

Google Stock uptrend holds as momentum cools near 386–390

Google Stock (GOOGL) remains in a firm daily uptrend, while intraday momentum cools. The base case stays bullish on the daily tape, yet near-term action skews to consolidation around the 386–390 pivot, where control likely shifts before the next directional leg.
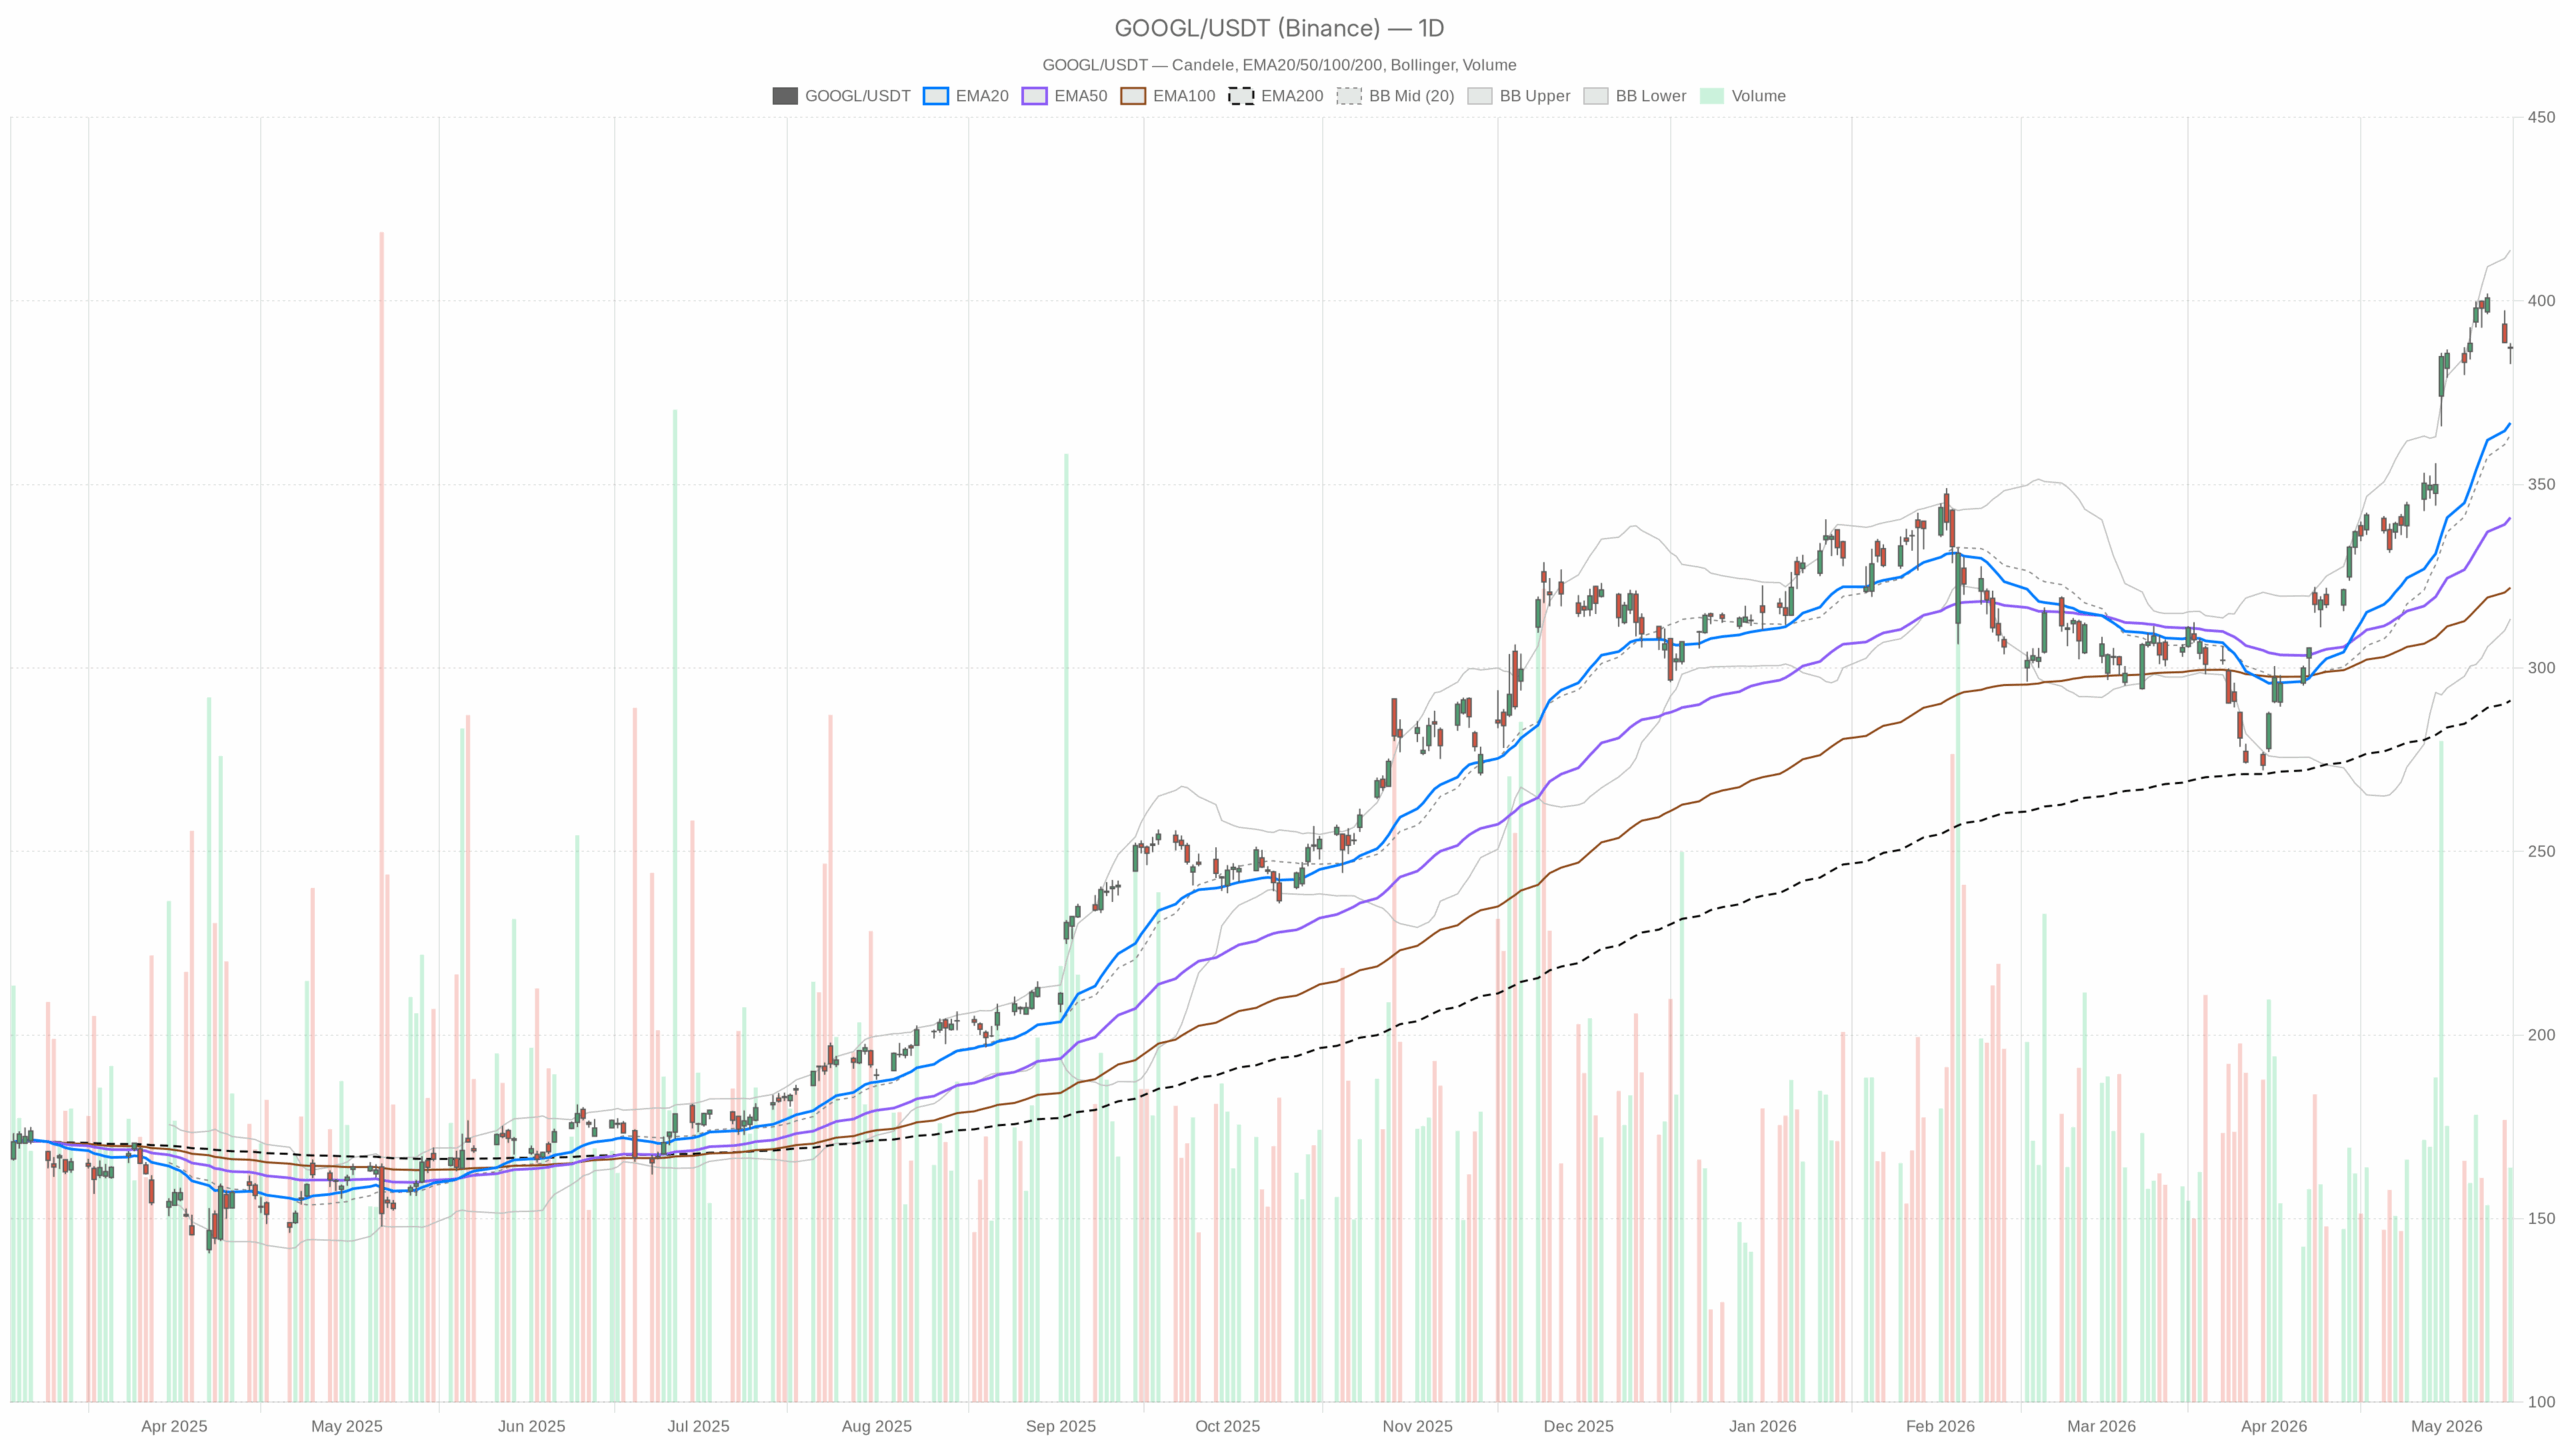 GOOGL — daily chart with candlesticks, EMA20/EMA50 and volume.
Google Stock Daily Trend: Uptrend Intact, Pivot in Focus
Trend and Momentum
GOOGL closed at 387.35. The 20-day EMA is 366.76, the 50-day is 340.99, and the 200-day is 291.12. The uptrend is well supported and firmly positive. Daily RSI14 sits at 70.4, keeping momentum hot and edging into overbought. The MACD prints 20.64 vs 18.95. The histogram is 1.69, which implies upside momentum persists, though follow-through is slowing.
Volatility and Pivots
Daily Bollinger Bands center on 363.61, with an upper band at 413.84 and a lower band at 313.38. Price is camped in the upper half, which fits a bullish regime but leaves room for mean reversion. Notably, ATR14 is 10.53, so typical swings can punish late entries. The daily pivot is 386.21, with R1 at 389.66 and S1 at 383.91. Price hovers just above the pivot, an immediate gauge of control.
Headlines and Context Supporting Google Stock
Recent headlines remain supportive for Google Stock after a strong quarter. Coverage highlighted that Q1 2026 results “crushed estimates,” driven by AI and Google Cloud strength; that earnings impulse fueled the latest leg higher. However, rising capex and free-cash-flow pressure could temper multiple expansion. Meanwhile, Reuters reported policy changes on spam to address EU concerns, modestly easing a regulatory overhang.
Google Stock Intraday: 1H Momentum Soft
On the 1H chart, price closed at 387.44. The 20-EMA is 390.2 and the 50-EMA is 387.43, leaving price under the faster average and pinned to the 50-EMA. That setup signals a flat-to-soft intraday bias.
Hourly RSI14 is 42.08, showing buyers are easing off. The MACD reads -1.87 vs -0.85, with a -1.02 histogram, so momentum is negative and immediate follow-through is weaker. Hourly Bollinger Bands sit with a 392.26 midline, 402.94 upper, and 381.58 lower; price holds below the midline, reinforcing consolidation. ATR14 is 2.89. The hourly pivot is 387.11 with R1 at 388.13 and S1 at 386.41. Around the pivot, small breaks can whipsaw.
15-Minute Micro Structure: Stabilization Attempt
On the 15-minute chart, price closed at 387.44. The 20-EMA is 386.35, the 50-EMA is 388.89, and the 200-EMA is 387.29. Price sits above the 20-EMA, below the 50-EMA, and near the 200-EMA, a compression setup. RSI14 is 53.54, tilting slightly positive. The MACD is -0.77 vs -1.36, with a 0.59 histogram, signaling incremental improvement as the histogram turns positive.
Bollinger Bands center on 385.71, with an upper at 388.47 and a lower at 382.95. Price trades above the midline, indicating early stabilization. ATR14 is 1.19. The 15-minute pivot is 387.25 with R1 at 387.99 and S1 at 386.7, placing execution inflection squarely at 387–388.
Bullish Scenario for Google Stock
Holding above the daily pivot at 386.21 would keep the daily uptrend clean. A push through hourly R1 at 388.13 and daily R1 at 389.66 would confirm intraday follow-through.
On the 1H, a reclaim of the 20-EMA at 390.2 alongside RSI back above 50 would strengthen the case. A positive MACD cross would add confirmation, signaling buyers are back in control. From there, the daily upper Bollinger near 413.84 is the next broad reference. Upside room exists, though gains may be stair-stepped.
Bearish Scenario for Google Stock
Failure into 389–390, followed by a break below 386.41–386.21, would tilt the near-term balance lower. That shift would signal bulls are losing the intraday grip.
A decisive drop through daily S1 at 383.91 would open a deeper pullback toward the rising 20-day EMA at 366.76. If the 1H MACD stays negative and RSI holds sub-50, downside pressure is validated. On the 15-minute chart, losing S1 at 386.7 and the 200-EMA at 387.29 would be the early tell.
Overall Outlook: Decision Zone at 386–390 for Google Stock
Overall, the daily bias for Alphabet remains bullish, while intraday signals are mixed. Volatility is nontrivial with a daily ATR of 10.53, so two-way risk is real. Into the next sessions, the 386–390 band should remain the decision zone as the market digests a strong quarter, heavier capex needs, and a lighter regulatory overhang.


You May Also Like
Solana Price Prediction: Alpenglow Testing Puts $120 SOL Back in Play as AlphaPepe Crosses 8,600 Holders

Vietnam Plans to Officially Launch its Crypto Asset by Q3 2026


