

EBAY stock holds firm uptrend as GameStop bid fuels volatility

EBAY stock remains in a firm uptrend, with momentum hot as price tests near-term resistance. It closed at 113.01 on May 13, above the daily upper Bollinger band at 112.45—still bullish, though late in the swing and prone to cooling.
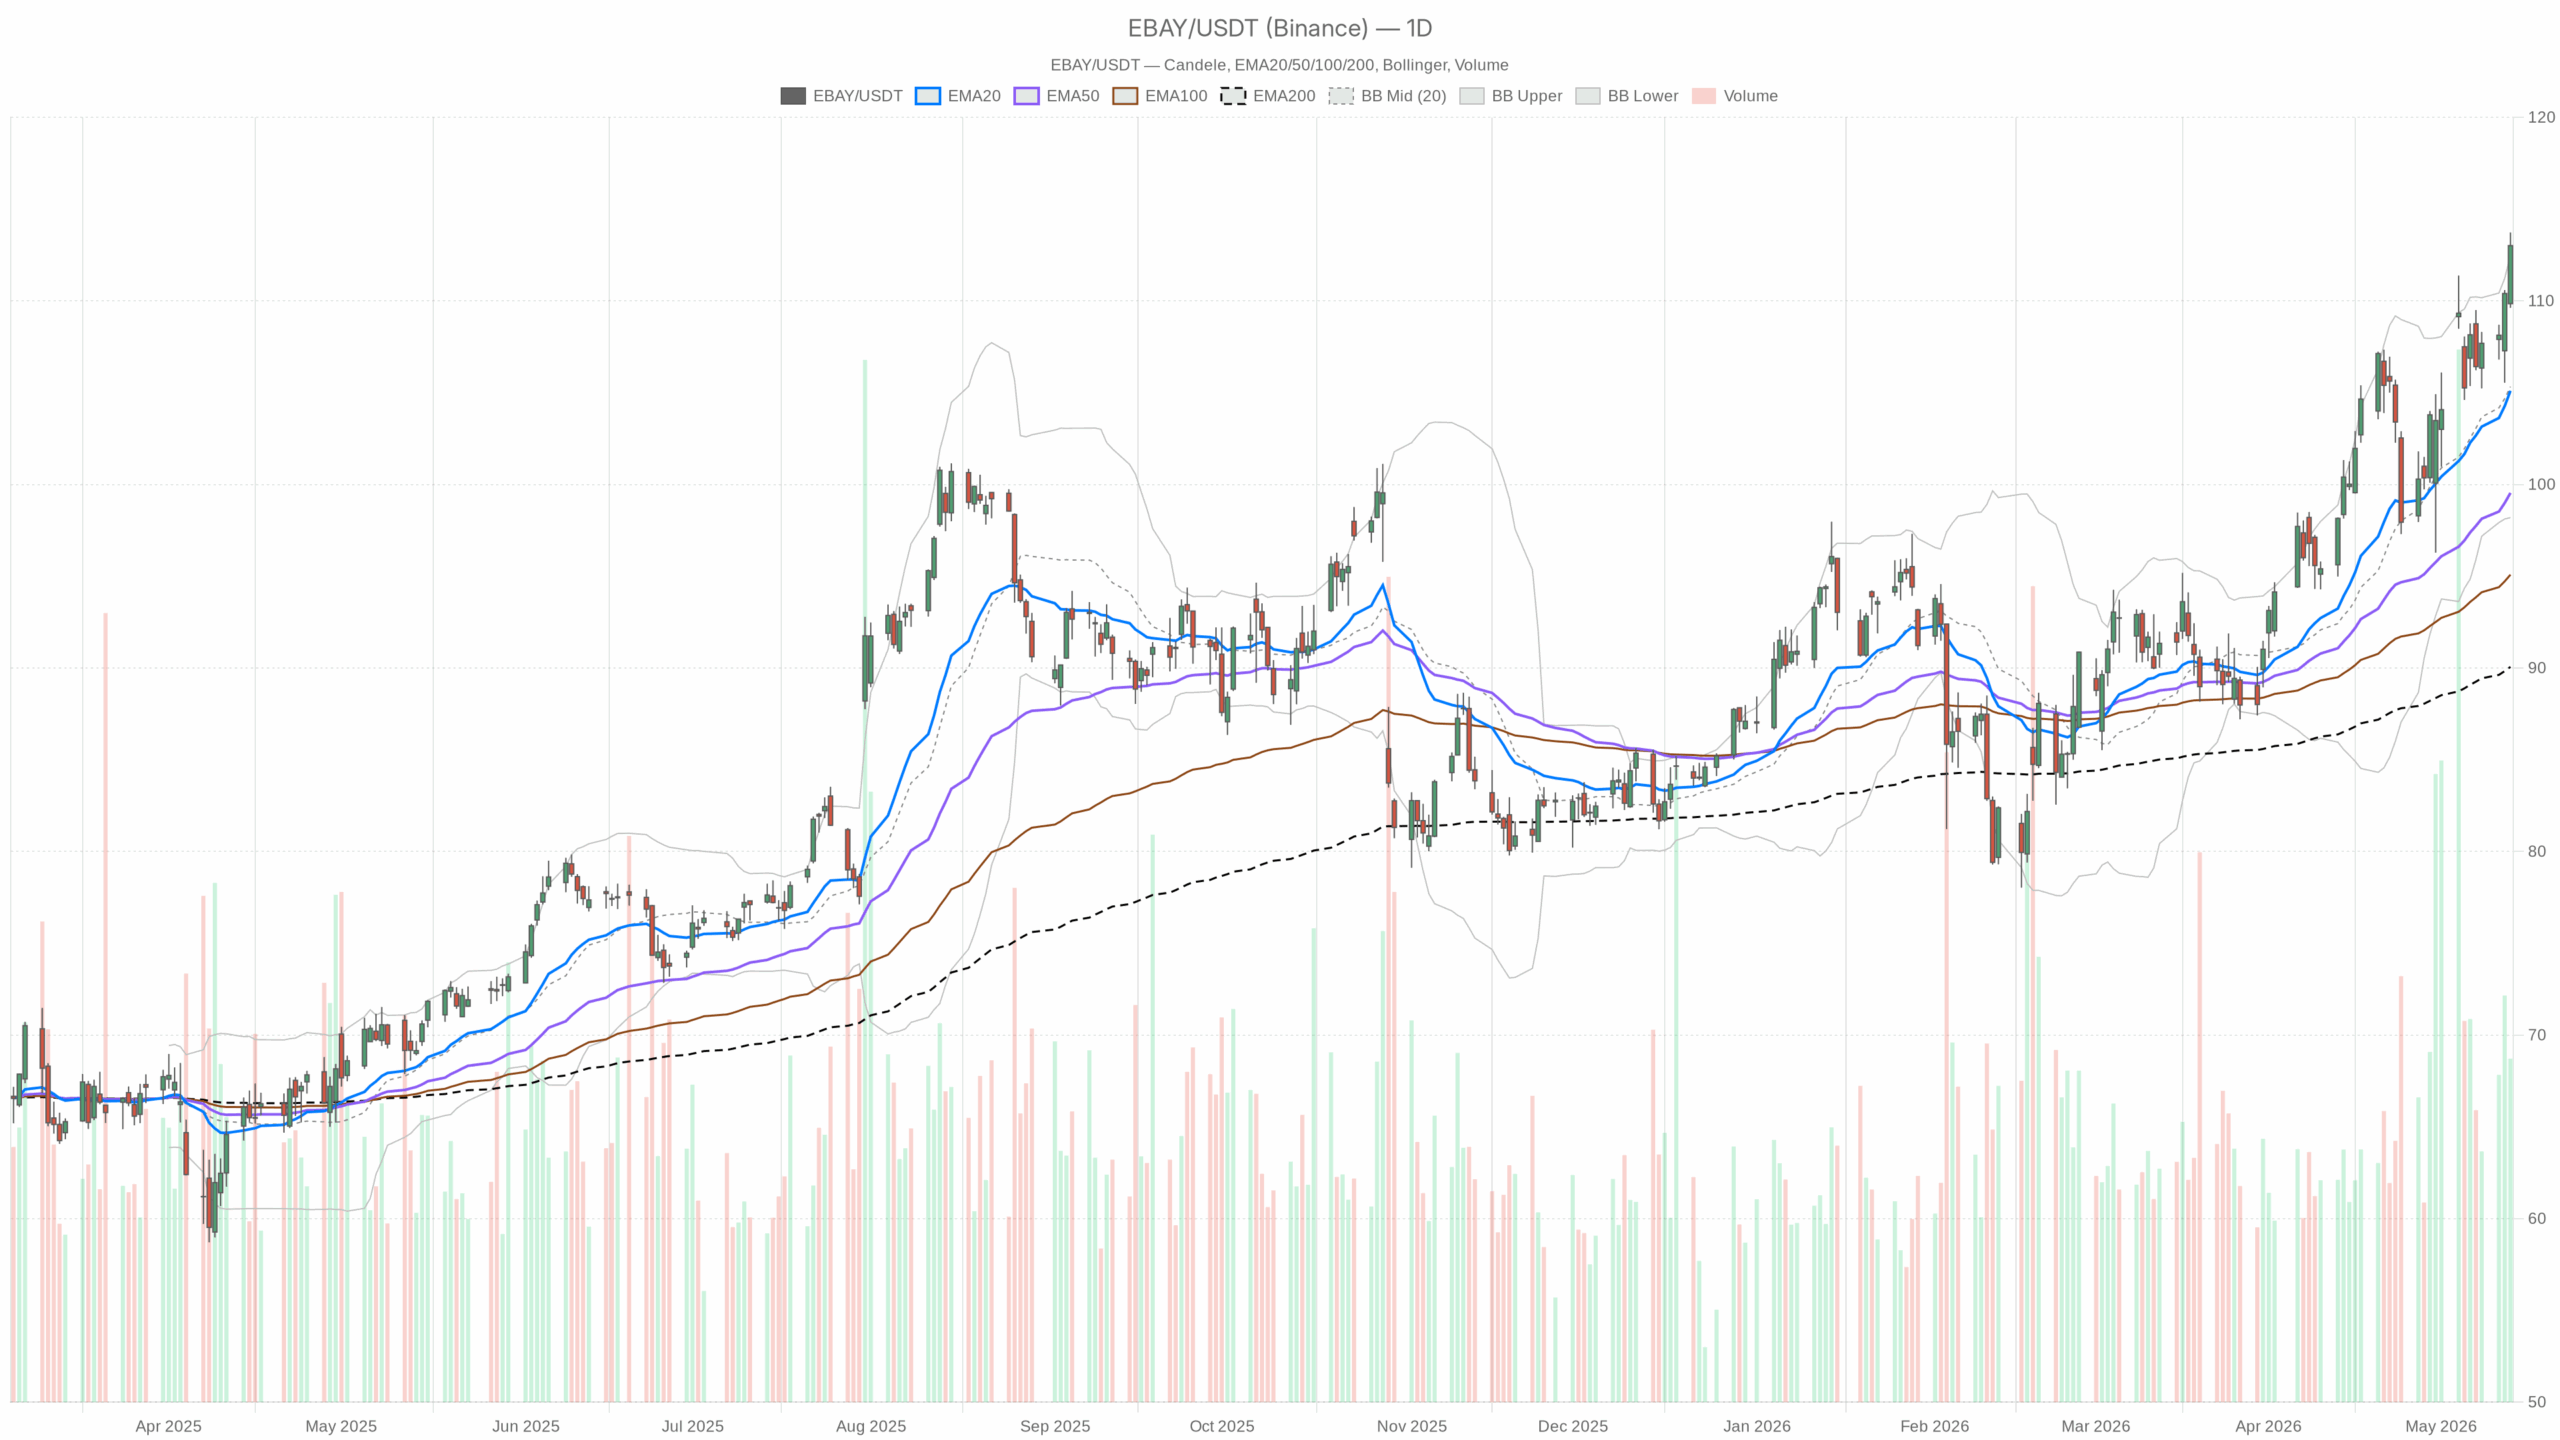 EBAY — daily chart with candlesticks, EMA20/EMA50 and volume.
EBAY Daily Technical Outlook
On the daily chart, trend strength is clear. The 20/50/200-day EMAs sit at 105.10/99.54/90.06 and slope higher. RSI(14) is 68.22, strong but not yet overbought. MACD shows line 3.61 vs signal 3.21, histogram 0.40, signaling momentum still building.
However, the close outside the band argues for tactful entries. The daily pivot is 112.12 with R1 114.62 and S1 110.51. Meanwhile, ATR(14) at 4.46 highlights wider swings. Overall, the setup keeps a bullish bias while discouraging late chases above stretched levels.
Intraday 1H Trend: EBAY Momentum Still Firm
Meanwhile, the 1H timeframe backs the bullish view. Price is 113.03 against an hourly EMA stack at 110.68/108.53/103.01, confirming an intraday uptrend. RSI(14) on 1H is 73.37, which is overbought and susceptible to pauses. MACD line 1.64 vs signal 1.28 with histogram 0.36 remains positive.
Hourly Bollinger mid stands at 110.07, with the upper band near 114.58, leaving room to probe higher before pressure builds. The 1H pivot sits at 112.88 with R1 113.73 and S1 112.18. Therefore, strength is intact, but brief mean reversion risk is elevated.
15-Minute Tape: Digestion Supports Dip-Buying
At the same time, the 15m tape shows digestion rather than breakdown. Price at 113.03 sits near the 15m Bollinger mid at 113.04, signaling balance after a push. The 15m EMAs at 112.69/111.26/108.12 still trend higher, keeping the micro uptrend intact.
Notably, RSI(14) is 58.58, reloaded from overbought and neutral-bullish. MACD line 0.61 vs signal 0.78 with histogram -0.18 shows a minor loss of short-term momentum. The 15m pivot is 112.72 with R1 113.42 and S1 112.34, offering clear execution markers for continuation versus pullback in EBAY shares.
Headlines and Event Risk for EBAY
Notably, headlines are amplifying upside appetite and volatility. eBay rejected GameStop’s $56 billion bid as “neither credible nor attractive,” while Ryan Cohen escalated criticism and vowed to keep pushing. Citi raised its EBAY price target to 127 with a Buy rating, citing better execution.
EBAY also printed a new high amid the noise, adding a sentiment tailwind. However, this kind of flow can swing intraday tape quickly. Therefore, respecting levels and the elevated ATR remains essential.
Bullish Scenario: Levels and Triggers
Therefore, the main scenario stays bullish. Holding above the daily pivot at 112.12 and the 1H pivot at 112.88 keeps buyers in control. A 15m push through 113.42, then 1H R1 113.73, would open a run at daily R1 114.62.
With daily MACD positive and rising EMAs, trend and momentum align. In turn, continuation remains the base case while dips stay shallow in EBAY stock.
Bearish or Corrective Scenario
On the other hand, a corrective path emerges if intraday support gives way. A 15m slip below 112.34 followed by a loss of 1H S1 112.18 would target daily S1 110.51. That would mark momentum cool-down and band reversion.
A decisive break of 110.51 would weaken the daily structure and shift focus toward the rising 20-day EMA at 105.10. Meanwhile, RSI backing off from elevated levels would fit that cooling narrative.
Positioning and Risk Management
Overall, positioning into strength requires discipline given the daily close above the upper band and an elevated ATR(14) ~4.46. Prefer strength after brief pullbacks toward 112.88–112.12 rather than chasing into 113.73–114.62.
Meanwhile, keep respect for the news tape around the GameStop bid and the upgraded analyst backdrop. The trend belongs to the bulls; still, short-term overextension and volatility argue for measured sizing and clear triggers in EBAY.


You May Also Like

BREAKING: FED Member Stephen Miran, Appointed by Donald Trump, Has Announced His Resignation

Fidelity launches AAA-rated tokenized fund via Chainlink – Details


