

Crypto Price Prediction for Today, May 14: Kaspa (KAS), XRP and Dogecoin (DOGE)
Crypto market activity remained mixed during the past 24 hours as several altcoins struggled near major resistance zones. Kaspa, XRP, and Dogecoin each approached key levels that could decide whether bulls regain control or sellers continue slowing down recovery attempts.
Kaspa price action remains especially interesting because the same resistance near $0.041 has repeatedly rejected bullish rallies since January. XRP price also continues trading inside a very tight structure after losing support briefly yesterday. Dogecoin, meanwhile, still trades beneath the same resistance that has capped upside attempts for months.
That combination creates an important setup for today’s market session.
Kaspa Price Continues Struggling Beneath a Major Resistance Zone
Kaspa price continues trading under strong resistance near $0.041 after another failed breakout attempt. That level has rejected the KAS price several times since January. Previous rejections from that region later produced declines of 38% and 25%.
Recent price action now shows another decline developing after Kaspa failed to sustain upward pressure again. The KAS price has already dropped about 8% from the latest local high.
A look at the Kaspa chart shows the rising trendline from February still acting as the main bullish support. Sellers have pushed price lower during the past 2 days. The trendline now appears to be the first logical bearish target if downside pressure continues.
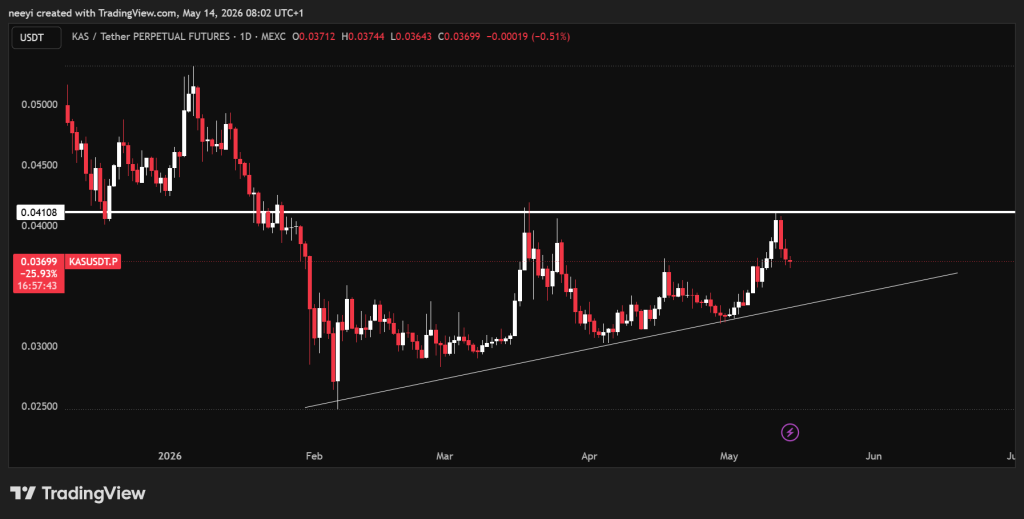 KAS Price Chart / TradingView.com
Kaspa currently trades near $0.037. That leaves price sitting dangerously close to the key support around $0.0364. A clean break below that level could open the path toward $0.0347 during the next few days.
Resistance near $0.0386 now becomes extremely important for short term direction. Buyers need to reclaim that region quickly. Another successful break above it could allow the KAS price to target the major $0.041 resistance again.
The current indicators still show weak bullish strength overall.
The RSI currently reads 45.669. That reading shows neutral market conditions because momentum remains balanced between buyers and sellers. The STOCH reading near 25.274 still leans bearish because price remains close to oversold territory without a confirmed reversal yet.
Williams %R currently sits near -87.891. That reading shows oversold conditions developing after the recent decline. Ultimate Oscillator also remains weak at 40.401. ROC currently prints -5.476. That reading confirms bearish momentum still controls short term direction.
| Name Of Indicator | What The Indicator Shows | How It Is Interpreted |
|---|---|---|
| RSI (14) | Momentum strength | Neutral conditions remain active |
| STOCH (9,6) | Market momentum shifts | Sell pressure still dominates |
| Williams %R | Overbought or oversold conditions | Market remains oversold |
| Ultimate Oscillator | Combined momentum trend | Weak bullish pressure |
| ROC | Speed of price movement | Negative momentum remains active |
Kaspa Price Prediction for Today
A bullish scenario could develop if the KAS price breaks above the $0.038 resistance zone. That move may allow buyers to challenge the major $0.041 resistance again today.
A neutral scenario could keep Kaspa trading between the $0.036 and $0.038 region throughout the day. Price consolidation inside that range would show continued uncertainty.
A bearish scenario becomes stronger if the KAS price falls below the $0.036 support region. That breakdown could send price toward $0.0347 afterward.
XRP Price Holds a Critical Support Structure Near $1.41
XRP price briefly traded below the important $1.41 to $1.42 support region yesterday. Price moved lower temporarily, although the overall structure still remains neutral because XRP continues trading inside a clearly defined range.
The $1.41 to $1.42 area remains the key support zone for today. A breakdown below that structure could expose lower targets near $1.38 and possibly $1.32 if selling pressure increases further.
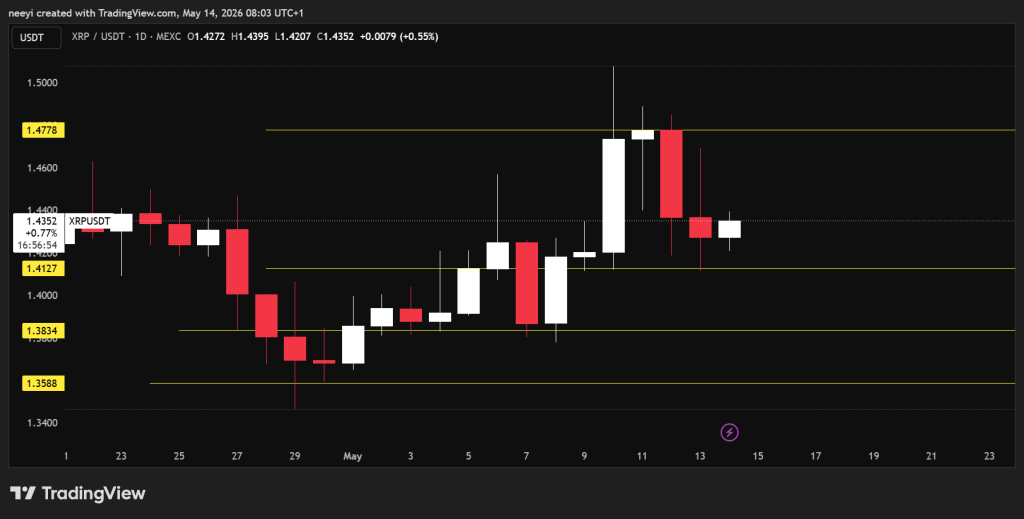 XRP Price Chart / TradingView.com
Upside recovery still depends heavily on the resistance near $1.47. Buyers need to reclaim that level before stronger bullish continuation becomes possible. A successful breakout there could open the path toward the strong resistance around $1.50.
Current technical indicators still show mixed momentum conditions.
The RSI currently stands near 48.991. That reading still shows neutral market conditions because neither buyers nor sellers fully control momentum yet. STOCH remains weak near 34.991. That reading shows short term bearish pressure remains active.
Williams %R currently sits near -71.99. That reading shows XRP remains close to oversold conditions. Ultimate Oscillator also remains soft at 44.456. ROC currently prints -0.885. That reading confirms momentum still leans slightly bearish.
| Name Of Indicator | What The Indicator Shows | How It Is Interpreted |
|---|---|---|
| RSI (14) | Momentum strength | Neutral price structure remains active |
| STOCH (9,6) | Short term momentum | Sellers still control momentum |
| Williams %R | Overbought or oversold conditions | Market leans oversold |
| Ultimate Oscillator | Broader momentum direction | Weak bullish participation |
| ROC | Momentum speed | Slight bearish pressure remains |
XRP Price Prediction for Today
A bullish scenario could emerge if the XRP price breaks above the $1.47 resistance region. That breakout may allow price to challenge the $1.50 resistance afterward.
A neutral scenario may keep XRP trading between $1.41 and $1.47 throughout today’s session. Continued sideways movement would preserve the current consolidation structure.
A bearish scenario becomes more likely if XRP falls below the $1.41 support zone. That breakdown could expose the $1.38 level afterward.
Dogecoin Price Keeps Testing Resistance Near $0.115
Dogecoin price continues struggling beneath the same resistance region that has capped upside movement since February near $0.114 to $0.115.
A successful breakout above that zone could become very important for the DOGE price. Buyers may then begin targeting the January resistance area around $0.126.
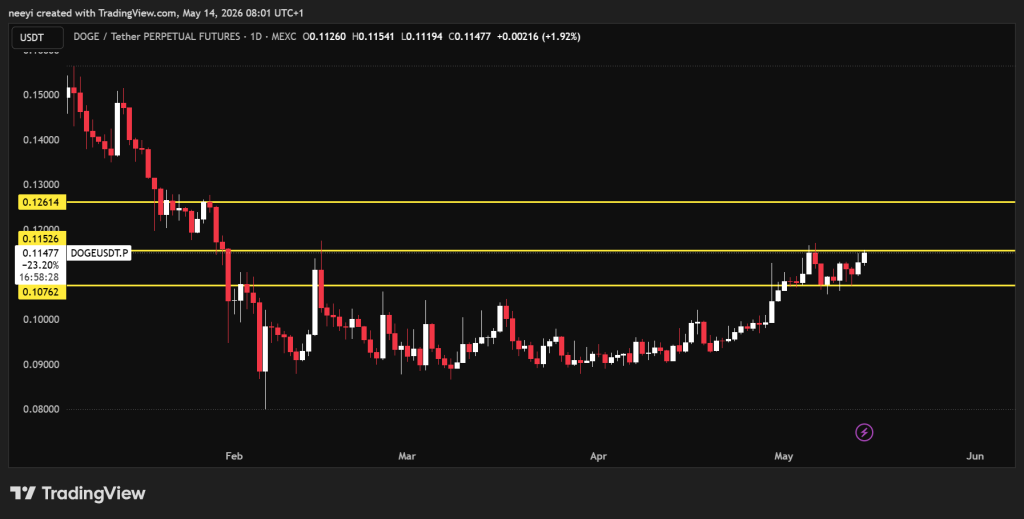 DOGE Price Chart / TradingView.com
The key support holding Dogecoin together during the past 2 weeks remains near $0.107. A break below that region could restart broader consolidation and expose lower levels again.
Current indicators still favor bullish pressure overall.
The RSI currently reads 60.984. That reading shows buyers still control momentum conditions. STOCH also remains bullish near 71.696 after recent upside pressure continued holding.
Williams %R currently sits near -7.224. That reading shows Dogecoin entering overbought territory after recent buying activity. Ultimate Oscillator remains strong near 61.297. ROC also remains positive at 4.786. That reading confirms bullish momentum still supports price action.
| Name Of Indicator | What The Indicator Shows | How It Is Interpreted |
|---|---|---|
| RSI (14) | Market momentum strength | Bullish momentum remains active |
| STOCH (9,6) | Momentum direction | Buyers still control short term direction |
| Williams %R | Overbought or oversold conditions | Market remains overbought |
| Ultimate Oscillator | Combined momentum trend | Bullish conditions remain active |
| ROC | Speed of momentum | Positive momentum continues |
Dogecoin Price Prediction for Today
A bullish scenario could emerge if the DOGE price breaks above the $0.115 resistance region. A successful retest afterward may allow price to climb toward $0.12 today.
A neutral scenario could keep Dogecoin consolidating between $0.11 and $0.115. That structure has remained active since the beginning of May.
A bearish scenario could develop if the DOGE price falls below the $0.107 support zone. That breakdown may send price toward lower consolidation levels again.
FAQs
Subscribe to our YouTube channel for daily crypto updates, market insights, and expert analysis.
The post Crypto Price Prediction for Today, May 14: Kaspa (KAS), XRP and Dogecoin (DOGE) appeared first on CaptainAltcoin.


You May Also Like

BREAKING: FED Member Stephen Miran, Appointed by Donald Trump, Has Announced His Resignation

Fidelity launches AAA-rated tokenized fund via Chainlink – Details


