Bitcoin Drops Again After Failed Recovery — $100K Support Now in Focus
Bitcoin price failed to recover above $105,000. BTC is trimming gains and might could continue to move down if it trades below $101,200.
- Bitcoin started a fresh decline after it failed to clear $105,500.
- The price is trading below $105,000 and the 100 hourly Simple moving average.
- There is a bearish trend line forming with resistance at $103,300 on the hourly chart of the BTC/USD pair (data feed from Kraken).
- The pair might continue to move down if it settles below the $101,200 zone.
Bitcoin Price Dips Further
Bitcoin price failed to stay in a positive zone above the $105,500 pivot level. BTC bears remained active below $105,500 and pushed the price lower.
The last swing high was formed at $107,400 before the price started a fresh decline. There was a drop below the $105,000 and $104,000 levels. The price dipped below the 61.8% Fib retracement level of the upward move from the $99,220 swing low to the $107,400 high.
Bitcoin is now trading below $104,000 and the 100 hourly Simple moving average. Besides, there is a bearish trend line forming with resistance at $103,300 on the hourly chart of the BTC/USD pair.
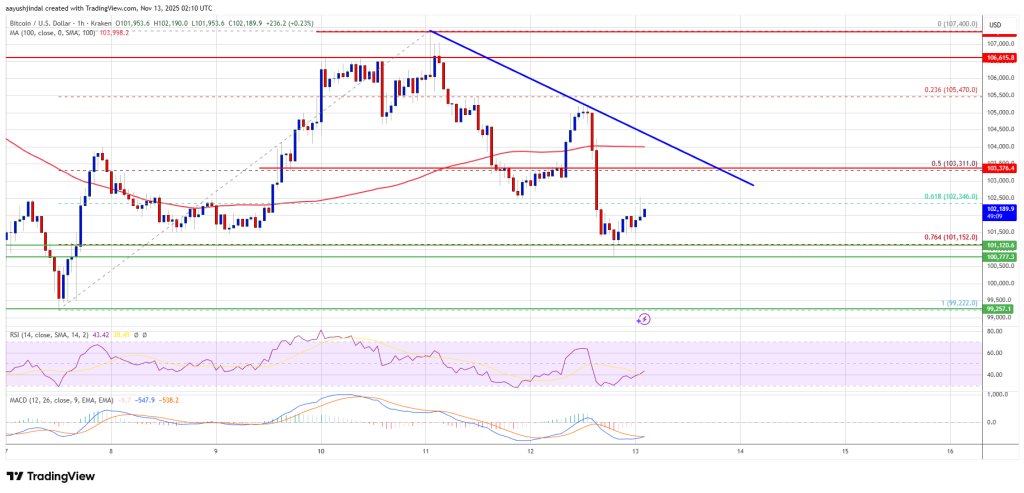
If the bulls attempt another recovery wave, the price could face resistance near the $102,500 level. The first key resistance is near the $103,250 level and the trend line. The next resistance could be $103,500. A close above the $103,500 resistance might send the price further higher. In the stated case, the price could rise and test the $105,000 resistance. Any more gains might send the price toward the $105,500 level. The next barrier for the bulls could be $106,800 and $107,000.
More Losses In BTC?
If Bitcoin fails to rise above the $103,500 resistance zone, it could start another decline. Immediate support is near the $101,200 level and the 76.4% Fib retracement level of the upward move from the $99,220 swing low to the $107,400 high. The first major support is near the $100,500 level.
The next support is now near the $100,000 zone. Any more losses might send the price toward the $98,800 support in the near term. The main support sits at $96,500, below which BTC might accelerate lower in the near term.
Technical indicators:
Hourly MACD – The MACD is now gaining pace in the bearish zone.
Hourly RSI (Relative Strength Index) – The RSI for BTC/USD is now below the 50 level.
Major Support Levels – $101,200, followed by $100,500.
Major Resistance Levels – $103,250 and $103,500.


You May Also Like

Indian rupee hits all-time low as oil rally and capital outflows intensify pressure

Bizarre loophole used as Marco Rubio China ban threatened to upend Trump trip: report