

BTC/USDT Order Book Analysis: Spot CVD Chart Highlights Key Volume Levels on May 14
BitcoinWorld
BTC/USDT Order Book Analysis: Spot CVD Chart Highlights Key Volume Levels on May 14
As of 9:00 a.m. UTC on May 14, the Spot Cumulative Volume Delta (CVD) chart for the BTC/USDT trading pair reveals distinct patterns in order flow and trade volume distribution. The chart, which breaks down buy and sell orders by capital size, offers traders a granular view of market pressure at specific price levels.
Understanding the Volume Heatmap
The top section of the chart displays a Volume Heatmap, which tracks the concentration of trades at various price points. When the price remains within a narrow range for an extended period, or when a significant price movement occurs, the heatmap’s background color intensifies. These brighter zones often act as potential support or resistance levels, as they represent areas where substantial trading activity has already taken place. For traders monitoring the BTC/USDT pair, identifying these high-volume nodes can help anticipate where the price might react.
Interpreting Cumulative Volume Delta by Order Size
The lower section of the chart tracks the Cumulative Volume Delta (CVD), which categorizes buy and sell orders by the size of the capital involved. As buy orders increase, the corresponding colored line rises. The yellow line, for example, represents orders between $100 and $1,000, typically associated with retail traders. In contrast, the brown line tracks large orders ranging from $1 million to $10 million, often linked to institutional activity or large-scale accumulators.
Why Order Size Matters
By segmenting the CVD by capital size, analysts can distinguish between retail-driven momentum and institutional positioning. A rising brown line combined with a flat yellow line, for instance, might suggest that large players are accumulating while smaller traders remain hesitant. This divergence can offer early signals of a potential trend shift. As of the May 14 snapshot, the relative movement of these lines provides a real-time window into who is driving the market.
Implications for BTC/USDT Traders
For active traders, the Spot CVD chart serves as a practical tool for assessing market depth and order flow imbalance. The heatmap highlights price levels where liquidity is concentrated, while the CVD reveals whether buying or selling pressure is dominant among different capital tiers. Together, they help form a more complete picture of supply and demand dynamics. As always, these indicators are most effective when used in conjunction with other technical analysis tools and risk management strategies.
Conclusion
The Spot CVD chart for BTC/USDT as of May 14 offers a data-driven look at current market structure, highlighting key volume levels and the behavior of both retail and institutional order flows. For traders seeking an edge in order book analysis, these metrics provide actionable insights into potential support, resistance, and directional bias.
FAQs
Q1: What does the Volume Heatmap show in a Spot CVD chart?
The Volume Heatmap tracks the volume of trades executed at specific price levels. Brighter areas indicate higher trading activity, which can act as potential support or resistance zones.
Q2: How is the Cumulative Volume Delta (CVD) calculated?
The CVD aggregates buy and sell orders, categorizing them by capital size. Each line represents the cumulative delta for orders within a specific range, such as $100 to $1,000 or $1 million to $10 million.
Q3: Why is it useful to separate orders by size?
Segmenting orders by capital size helps distinguish between retail and institutional activity. This can reveal whether large players are accumulating or distributing, providing early signals of potential trend changes.
This post BTC/USDT Order Book Analysis: Spot CVD Chart Highlights Key Volume Levels on May 14 first appeared on BitcoinWorld.


You May Also Like
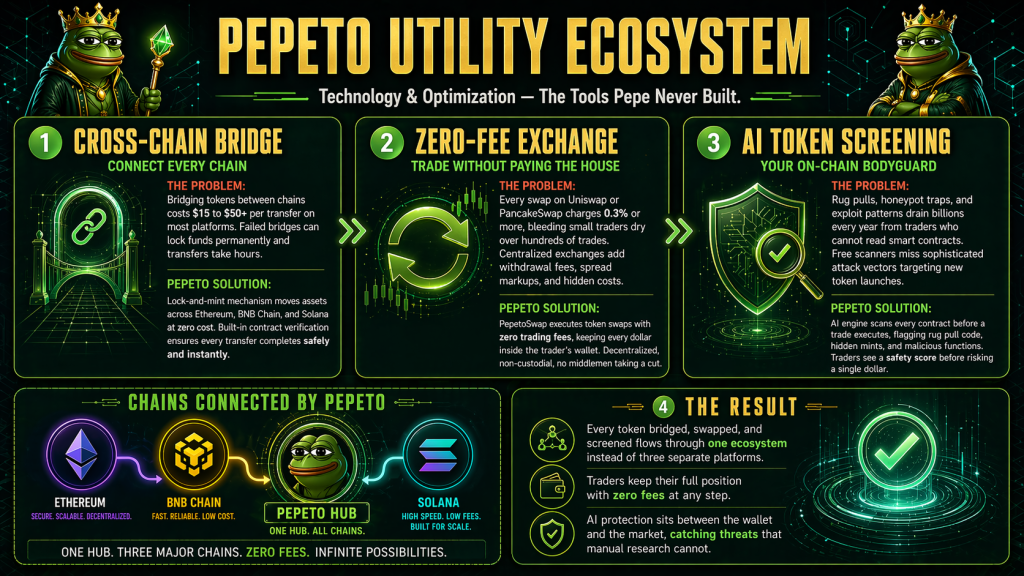
Which Are the Top 3 Cryptos to Buy Now as Solana Lands Mastercard and Pepeto Presale Nears Sold-Out Close
Ondas (ONDS) Stock Soars After Revenue Explodes Over 1,000% in Q1 2026


