Eli Lilly and Company valuation split widens as GLP‑1 drives 2026 forecasts
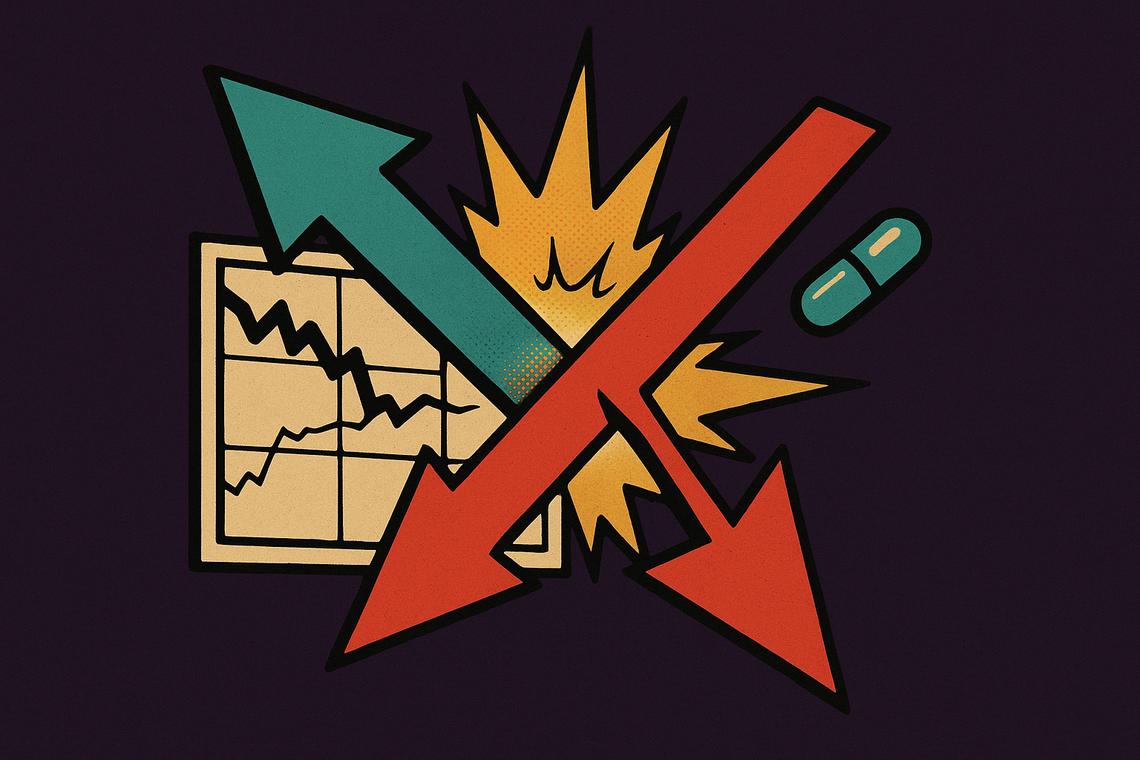
Investor focus is turning to how far the latest rally in eli lilly and company can go as valuation models and long‑term guidance diverge.
Eli Lilly and Company after a 43% stock rally
Eli Lilly and Company has delivered a powerful share‑price performance, with one valuation screen noting a 43.0% return over the last 12 months. Consequently, investors are increasingly asking whether the current level already discounts years of growth, or whether the market is still underestimating the company’s GLP‑1 opportunity and broader pipeline.
Despite the strong rally, a recent Simply Wall St analysis argues the stock may remain attractive, using both discounted cash flow and earnings‑multiple comparisons. Together, these approaches frame a debate between momentum concerns and fundamentals‑driven upside potential.
DCF view suggests Eli Lilly and Company may still be undervalued
In the Simply Wall St report, Eli Lilly and Company closed at $1,015.75 per share. However, the firm’s discounted cash flow model estimated an intrinsic value of about $1,404 per share. This implies the stock was trading at roughly a 27.7% discount to its modeled fair value, under the assumptions embedded in that DCF scenario.
Based on this work, the stock screened as “UNDERVALUED.” This conclusion is notable, because it contrasts with the common perception that a company with such a large rally and premium valuation multiples must automatically be expensive. Instead, the DCF highlights how expectations for future cash flows, particularly from key growth drivers, can still justify further upside.
P/E comparison and the Fair Ratio framework
Simply Wall St also evaluated Eli Lilly and Company through its proprietary “Fair Ratio” approach, which focuses on the price‑to‑earnings multiple. The analysis cited a Fair Ratio P/E of 37.2x. In comparison, Eli Lilly’s current P/E was 35.8x, versus a peer average of 23.3x.
Therefore, while the company clearly trades at a substantial premium to its peer group, it still sits modestly below the Fair Ratio benchmark used in this framework. According to the screen, this relative position reinforces the “UNDERVALUED” label when judged against the specific profitability and growth expectations that the Fair Ratio captures.
Bull and bear narratives anchored in GLP‑1 and tirzepatide dynamics
The Simply Wall St work does not stop at a single fair‑value point. Instead, it offers two explicit “Narratives” for Eli Lilly and Company, designed to reflect different views on GLP‑1 demand, production capacity, and policy or competitive risks. These narratives translate directly into distinct fair‑value estimates.
Under the Bull Narrative, the fair value is calculated at $1,189.18 per share. This scenario likely assumes robust GLP‑1 and tirzepatide uptake, alongside manageable bottlenecks in scaling production and no severe impact from future pricing changes. It implies meaningful upside from the cited spot price, although less than the central DCF estimate.
Conversely, the Bear Narrative yields a fair value of $899.73 per share for Eli Lilly and Company. This more cautious view is tied to risks like weaker‑than‑expected GLP‑1 demand, more persistent capacity constraints, or heavier pressure from drug pricing reforms and competition. While still close to the prevailing market level in the report, it suggests limited upside and potential downside if the most optimistic assumptions do not materialize.
How GLP‑1 expectations shape perceived valuation risk
The gap between $1,189.18 and $899.73 illustrates how sensitive the valuation of Eli Lilly and Company is to GLP‑1 and tirzepatide trajectories. As a result, even modest changes in assumptions around long‑term volume, pricing, or production efficiency can shift fair‑value estimates by hundreds of dollars per share.
For investors, this underscores that much of the current debate is less about traditional multiples and more about the durability and scale of GLP‑1 demand. It also highlights why some market participants are comfortable with premium valuations, while others remain concerned about future policy shifts or competitive entries that could erode profitability.
Analyst targets support a constructive medium‑term outlook
Recent analyst commentary compiled by Insider Monkey provides another lens on how the market views Eli Lilly and Company. After the latest first‑quarter results, Barclays raised its price target to $1,400 from $1,350, maintaining an Overweight rating. In parallel, Goldman Sachs reiterated a Buy rating with a price target of $1,283.
These targets sit broadly in line with, or slightly below, the DCF intrinsic value from Simply Wall St, yet above the Bear Narrative fair value. Consequently, they signal that major covering analysts remain constructive on the company’s medium‑term prospects, even after substantial share‑price gains.
What 2026 guidance says about Eli Lilly and Company growth expectations
Insider Monkey also highlights updated guidance from Eli Lilly and Company for 2026. The company now forecasts full‑year revenue in a range of $82–$85 billion. At the midpoint, this corresponds to around 28% growth versus 2025, underlining how management sees continued strong expansion ahead.
Non‑GAAP earnings per share for 2026 are guided between $35.50 and $37. This combination of high‑20s revenue growth and substantial earnings power helps explain why valuation models and analyst targets remain supportive, even at a time when the stock already trades at a notable premium to peers.
Balancing valuation, growth and risk for Eli Lilly and Company
Across DCF analysis, Fair Ratio P/E comparisons, and explicit Bull and Bear Narratives, one conclusion stands out: current pricing of Eli Lilly and Company is tightly linked to expectations for GLP‑1 and tirzepatide. Strong 2026 revenue and EPS guidance, together with analyst targets up to $1,400, reflect confidence that these products can sustain significant growth.
At the same time, the wide range between optimistic and cautious valuation scenarios highlights real uncertainty around capacity execution, competitive dynamics and potential drug‑pricing reforms. For investors, the key question is whether the long‑term opportunity justifies accepting that risk, even after a 43% rally and at P/E levels well above industry averages.


You May Also Like

Rocket Lab, Intuitive Machines, and Planet Labs: Which Space Stock Stands Out?
'Lipstick on a pig': Behind Trump's bombastic claims lies a trail of failed initiatives