Alphabet Stock stalls near 400 as uptrend stays intact

Alphabet Stock remains in a durable daily uptrend, but near-term momentum is cooling near the 400 handle. The bias stays bullish on the daily chart, while the hourly picture shows digestion after a sharp run. That mix argues for push-and-pull around key pivots rather than a breakout today.
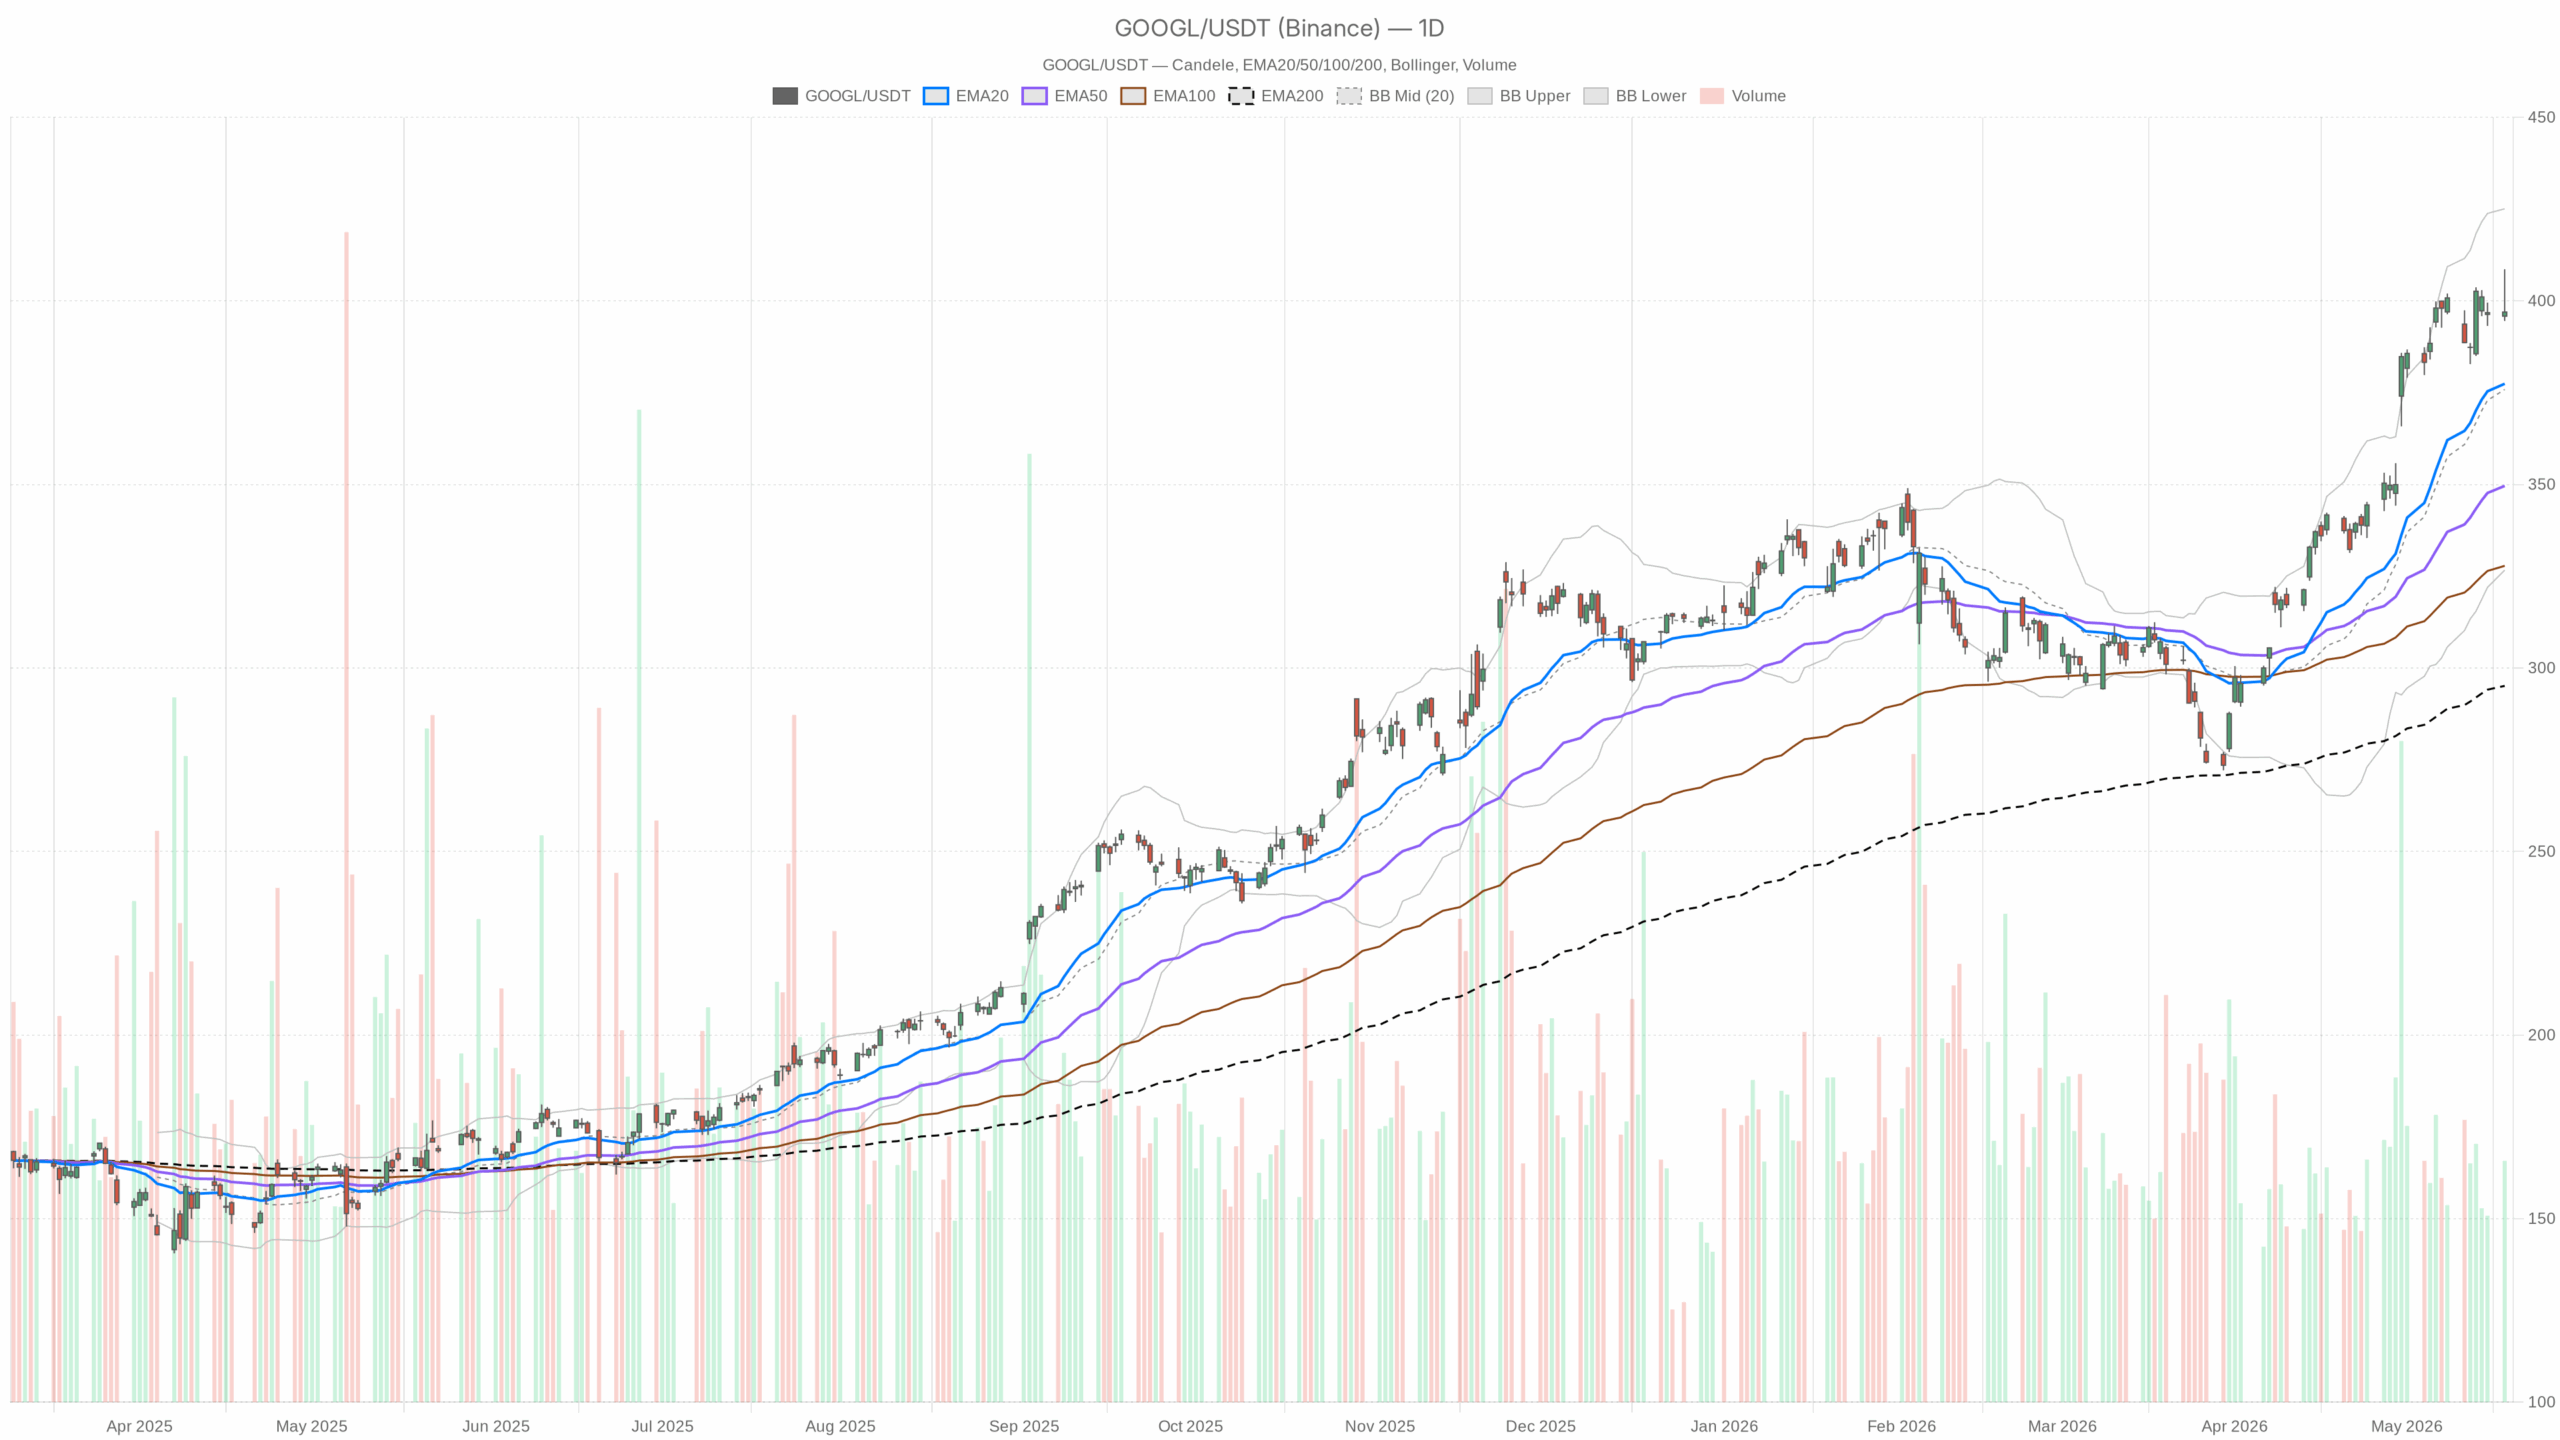 GOOGL — daily chart with candlesticks, EMA20/EMA50 and volume.
Alphabet Stock Technical Overview: Daily Uptrend, Momentum Cooling Near 400
Trend and Price Context
On the daily timeframe, GOOGL closed at 396.94 after a 408.61 intraday high. Price trades well above rising moving averages. Trend leadership is intact and the daily regime remains bullish.
Momentum and Volatility
EMA20/50/200 sit at 377.43 / 349.60 / 295.11, confirming a strong uptrend and supportive dip demand. RSI14 is 70.3. Momentum is hot and slightly stretched.
MACD (line 19.38, signal 19.67, hist -0.29) shows upside momentum easing. Therefore, follow-through may slow. Meanwhile, Bollinger Bands (mid 375.87, upper 425.09, lower 326.64) keep price above the mid-line with room toward the upper band. ATR14 is 11.63, signaling wide daily ranges.
Key Daily Levels
Daily pivot levels: PP 400.03, R1 405.52, S1 391.44. Notably, price closed just below PP, making 400 the immediate battleground.
Hourly Chart: Consolidation Around 398–400
Structure and Momentum
Meanwhile, the hourly timeframe softens the daily strength. Latest close is 396.96, and the H1 regime is neutral. The trend is pausing, not reversing.
EMA20/50/200 are 398.63 / 395.43 / 366.49. Price sits below the 20 but above the 50, which is typical of consolidation. RSI14 prints 47.7. MACD (line 0.74, signal 1.18, hist -0.44) shows fading intraday momentum, favoring range trading over an immediate breakout.
Intraday Levels
Bollinger mid is 399.15 with bands at 404.14 and 394.16. Price is hugging the lower half, which reflects mild pressure. ATR14 is 3.95. H1 pivot: PP 396.99, R1 398.07, S1 395.88. Therefore, 398–399 should act as initial resistance.
M15 Execution Window: Controlled Pullback Near 396–397
In the execution window, the 15-minute chart leans cautious. Latest close is 396.96, and the M15 regime is neutral. The micro-trend is corrective within the bigger uptrend.
EMA20/50/200 are 399.36 / 399.46 / 396.30. Price is below the fast EMAs but near the 200, which often attracts dip-buyers. RSI14 is 38.75, so short-term momentum is soft, not washed out.
MACD (line -0.81, signal -0.27, hist -0.54) is negative, so timing favors patience on entries. Bollinger mid is 400.23 with bands at 404.43 and 396.04. ATR14 is 1.56. M15 pivot: PP 396.99, R1 398.07, S1 395.88. Therefore, the 396–397 area is the immediate balance zone.
News and Narrative: AI Catalysts Support the Trend for GOOGL
However, the news backdrop keeps the medium-term story constructive. Headlines flag Google’s AI showcase at I/O and leaks around Gemini Spark agentic tools. That supports the AI narrative without guaranteeing immediate price action. Notably, commentary on TPU sales as a new growth engine and the recent yen bond issue add capacity and optionality. Expectations are high, which can amplify near-term volatility for Alphabet Stock.
Bullish Scenario: Reclaim 400–405 to Reassert Control
Therefore, the main scenario remains bullish on the daily chart, with a bias to buy strength on confirmation. Strength would look like a sustained reclaim of the 400 daily pivot and an hourly close back above the H1 EMA20. That combination would indicate buyers have retaken near-term control.
Bullish triggers to watch: a move and hold above 400.03. Acceptance above 405.52 (R1) would open a retest of Monday’s 408.61 high. With ATR at 11.63 and the upper daily band near 425, upside extensions intraweek are feasible if momentum re-accelerates. The EMA stack on D1 and an RSI anchored near 70 would support trend continuation when hourly momentum turns up. Human read: trend is up; confirm with a clean reclaim of 400–405.
Bearish Scenario: Mean Reversion if 396–391 Breaks
On the other hand, the bearish setup is a break of support that forces mean reversion. A failure at 400 that slides below 395.88 (H1/M15 S1) and then 391.44 (D1 S1) would shift control to sellers. In that case, the first magnet is the daily EMA20 around 377–378 and the Bollinger mid near 376. MACD’s softening on D1 and negative intraday histograms would then validate a deeper pause. Human read: lose 391 on a daily basis and the bulls likely stand aside for a reset.
Positioning and Risk: Alphabet Stock Amid Active Ranges
Overall, positioning around Alphabet Stock should respect the prevailing uptrend while acknowledging cooling momentum and active ranges. Meanwhile, hourly neutrality weakens near-term conviction, so execution should hinge on the 400–405 band for validation and the 391–395 zone for risk control. Into AI-focused headlines, expect choppy flow and quick rotations. Stay alert to intraday pivots, because volatility can expand quickly when Google stock meets high expectations.


You May Also Like

HDFC Bank Shares Rise Amid Action Against More Executives

Zcash – Can its adoption match the hype as quantum narrative gathers steam?