Ethereum (ETH) Price Slides as Large Holders Reduce Positions Amid Rising Yields
Quick Overview
- Ethereum has declined more than 10% over the last seven days, reaching approximately $2,110, underperforming most major cryptocurrencies.
- Climbing US Treasury yields and inflation figures sparked widespread cryptocurrency liquidations, with the 30-year Treasury yield reaching 5.19%, the highest since 2007.
- ETH experienced over $700 million in long position liquidations during the past seven days.
- Wallets in the mid-tier range offloaded a total of 386,000 ETH from May 11 through May 18, while large whale accumulation patterns also started declining.
- Technical analyst Crypto Patel pinpointed $1,500 as a potential downside objective following ETH’s breakdown beneath a critical trendline at $2,170.
Ethereum is currently hovering near $2,110, showing modest gains after enduring a week of intense selling activity. The asset posted approximately 0.5% growth on Tuesday, though the overall outlook continues to appear fragile.
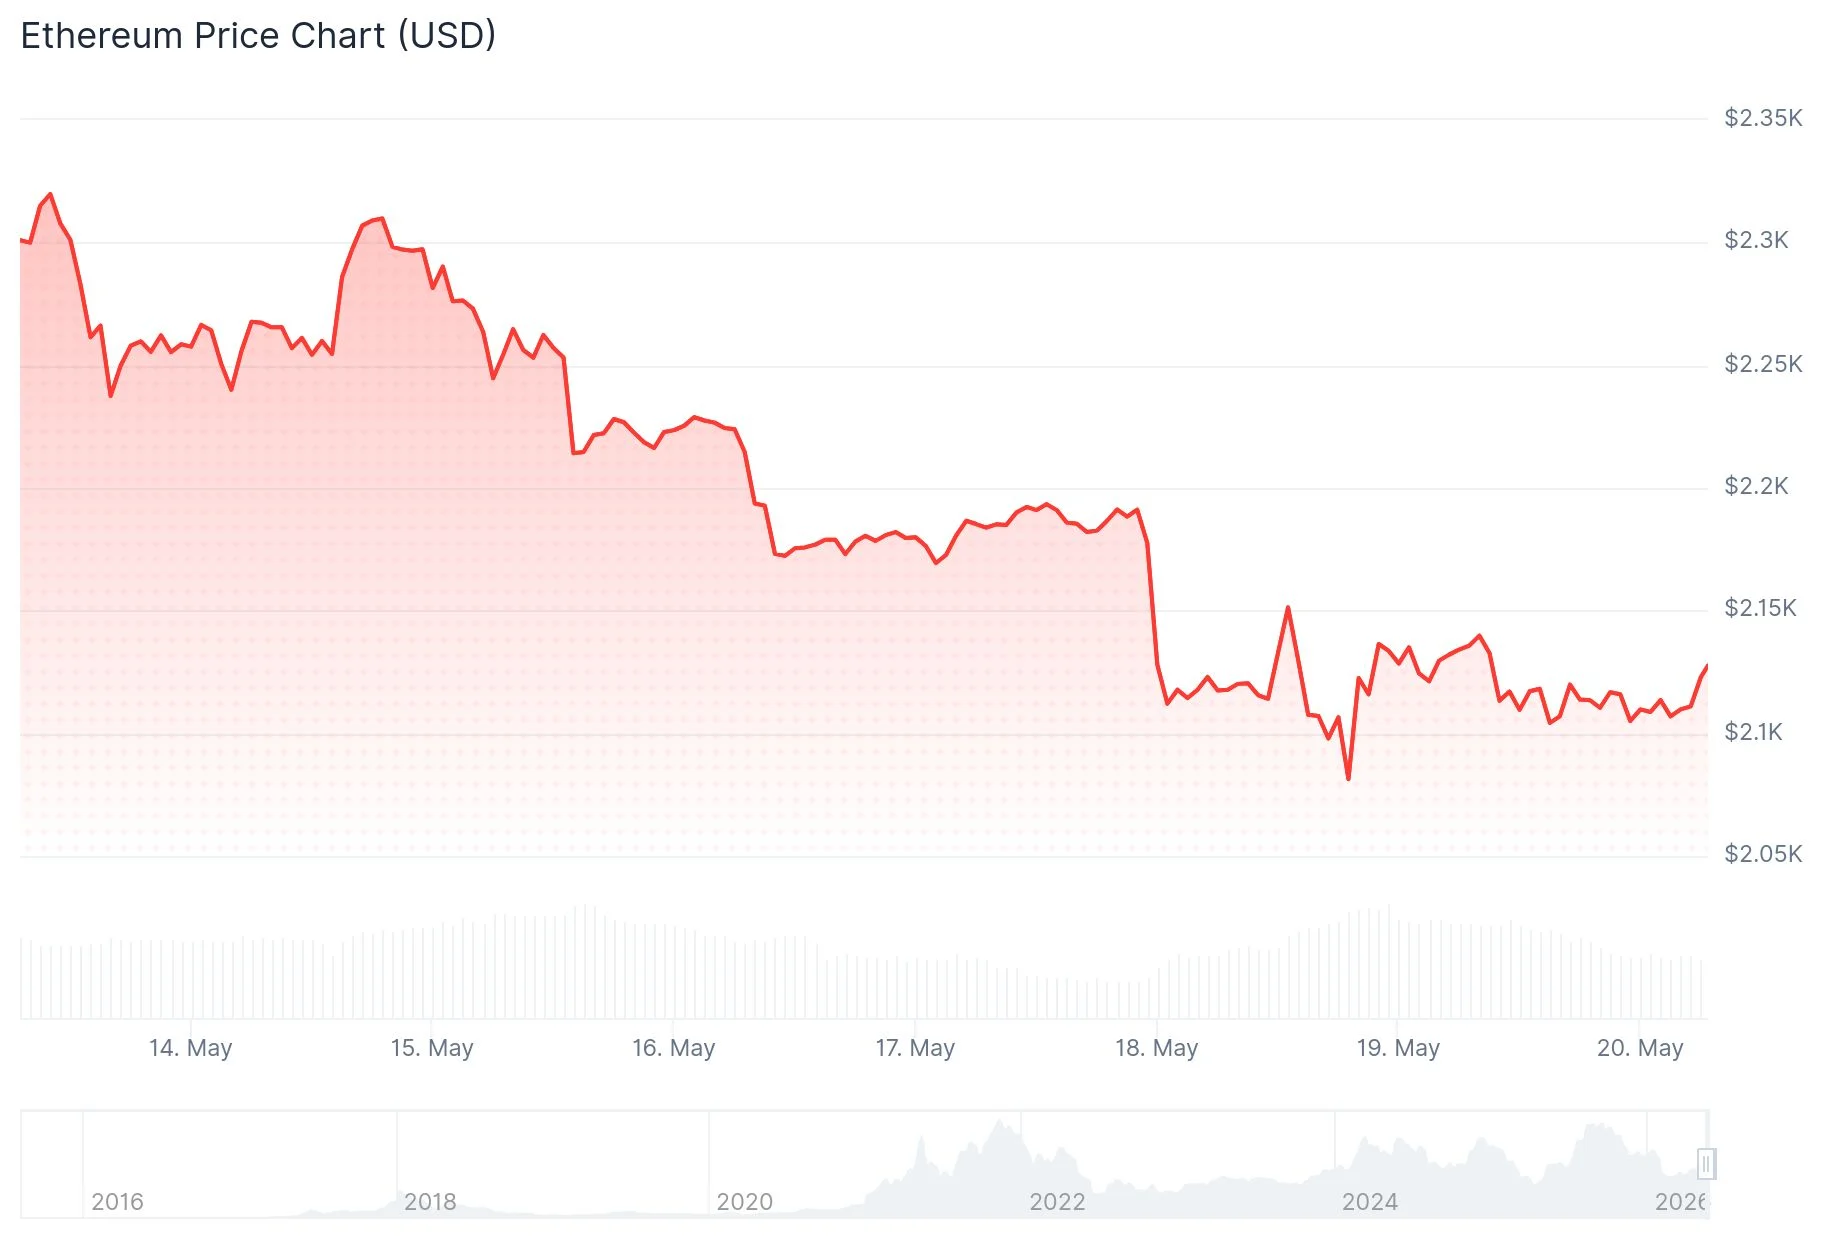 Ethereum (ETH) Price
The downturn wasn’t limited to Ethereum alone. A significant surge in US Treasury yields redirected investment capital away from riskier assets throughout financial markets. The 30-year US Treasury yield climbed to 5.19%, marking the highest reading since 2007. Meanwhile, Japan’s 10-year government bond yield also reached an unprecedented high of 2.81%. Rising yields typically encourage investors to favor safer, yield-producing instruments, creating downward pressure on digital assets.
Nevertheless, Ethereum experienced more severe losses compared to its peers. Data from Coinglass reveals that ETH saw more than $700 million in liquidated long positions throughout the past week, surpassing Bitcoin’s liquidation volumes during the identical timeframe. Derivatives market indicators had already signaled mounting pressure on leveraged long positions before the decline materialized.
Blockchain Data Reveals Persistent Selling Activity
Onchain metrics from CryptoQuant demonstrate that addresses holding between 100 and 10,000 ETH distributed a combined 386,000 ETH from May 11 through May 18. This selling behavior has been ongoing for several months.
Large whale wallets initially provided buying support during the dip, accumulating roughly 330,000 ETH throughout that period. However, these same addresses subsequently reduced their positions by 60,000 ETH in subsequent days, indicating potential uncertainty about maintaining positions at present price levels.
Analyst Ali Charts highlighted a troubling development on social platforms: approximately 60 whale addresses controlling 10,000 ETH or more have either completely liquidated their holdings or consolidated balances over the previous two months. He observed this corresponds with substantial exchange deposit activity and suggested the most likely direction remains “down,” while monitoring the $2,000 threshold carefully.
Chart Analysis Suggests Further Downside Risk
On the daily timeframe, Ethereum is positioned beneath its 20-, 50-, and 100-day exponential moving averages, which are clustered between $2,245 and $2,333. The RSI indicator reads near 34 while the Stochastic Oscillator hovers around 12, both reflecting sustained bearish momentum without signs of imminent reversal.
Crypto analyst Crypto Patel observed via social media that ETH violated a significant ascending trendline at $2,170, transforming the market structure to bearish. He established a downside objective of $1,500 with an invalidation threshold at $2,327.
On shorter timeframes, ETH is developing a descending trend line with resistance positioned near $2,120. Inability to overcome $2,150 may trigger a retest of $2,075, with $2,000 representing the subsequent major support zone beneath current levels.
Critical resistance overhead includes $2,120, followed by $2,150, and $2,200. Immediate support levels are located at $2,085 and $2,075. A decisive break below these zones could expose the psychologically significant $2,000 level.
As of May 20, ETH is exchanging hands slightly above $2,108, with both technical chart patterns and blockchain metrics suggesting a cautious stance remains warranted in the immediate term.
The post Ethereum (ETH) Price Slides as Large Holders Reduce Positions Amid Rising Yields appeared first on Blockonomi.


You May Also Like

The changing face of elder care in Malaysia — Sayed Mohammad Reza Yamani Sayed Umar

One Of Frank Sinatra’s Most Famous Albums Is Back In The Spotlight

Not a loophole: Singapore AI export controls let China tap US AI legally