

PEPE Whales Open Massive 10x Longs as Traders Eye Breakout Move
PEPE whales open $3.37M in 10x longs as PEPE tests $0.00000491 resistance while traders watch for breakout confirmation.
Two large wallets opened 10x long positions on PEPE at the same time, according to shared market data.
The combined position reached 924.7 million kPEPE, valued near $3.37 million. The move came as PEPE traded around $0.00000368 on the daily PEPE/USDT chart.
Traders are now watching whether PEPE whales can help support a breakout attempt.
PEPE Whales Open 10x Long Positions
The reported 10x long positions have drawn attention across the PEPE market. Leveraged long trades often show that some traders expect price gains.
However, they also carry higher risk because small price moves can affect margin levels.
The combined exposure of $3.37 million is large for short-term sentiment. It does not confirm a price reversal, but it adds focus to PEPE price action.
Market watchers are tracking whether more whale activity follows this trade.
PEPE remains in a weak daily structure despite the whale positions. The token is still trading below the key Fibonacci level near $0.00000491.
That area is now viewed as the main resistance level on the PEPE/USDT chart. A daily close above $0.00000491 would improve the technical setup.
Until that happens, the broader chart remains neutral to bearish. The current long positions may face pressure if support levels fail.
PEPE Price Faces Key Breakout Zone
PEPE is trading near $0.00000368 after a long decline from earlier highs. The chart shows a breakdown from the prior range. It also shows a slow base forming near recent lows.
Immediate support sits around $0.0000033 to $0.0000035. This zone has helped price stabilize in recent sessions.
A break below it could bring a retest of the $0.0000030 area. Resistance is seen near $0.0000040 to $0.0000043.
The stronger barrier remains near $0.00000491. This level matches the 1.0 Fibonacci retracement shown on the daily chart.
A move above $0.00000491 could shift market focus toward $0.00000656. That level is marked as the 0.786 Fibonacci zone.
Further resistance appears near $0.00000785 and $0.00000876.
Read Also:
Indicators Show Cautious Market Conditions
The MACD remains close to the zero line on the daily chart. The histogram is small, which shows weak momentum. The MACD line is also close to the signal line.
This setup points to a market waiting for direction. A bullish MACD cross above zero would support a breakout case. A bearish cross could return attention to lower support zones.
The RSI is near 39.66, while its moving average is near 53.36. RSI below 50 shows that sellers still hold some control. It is not deeply oversold at current levels.
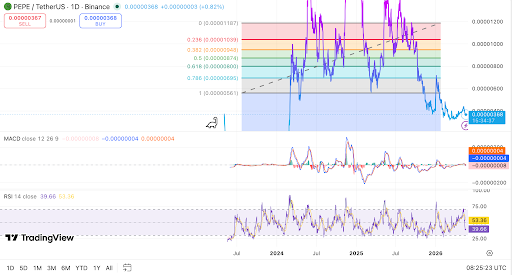 PEPE tests resistance while momentum remains weak. Source: TradingView.
A move above 50 would show better buying strength. A move above 60 would provide stronger technical confirmation. Until then, PEPE lacks a clear momentum shift.
The PEPE whale longs have added interest to the market. Still, the chart needs confirmation from price action.
Traders are watching $0.00000491 as the main breakout level for PEPE/USDT.
The post PEPE Whales Open Massive 10x Longs as Traders Eye Breakout Move appeared first on Live Bitcoin News.


You May Also Like

GitHub Security Breach Raises Supply Chain Risks for Crypto Developers

Home Depot (HD) Stock Tumbles to Two-Year Low Despite Beating Q1 Estimates


