

SUI Price Holds Important Support Zone As Buyers Slowly Step Back In

SUI price stabilizes near $1.04 support after a deep correction, while buyers watch the $1.15-$1.20 resistance range.
SUI price is holding an important support zone near $1.04 after a strong correction from earlier highs.
Buyers are slowly returning, and traders are watching whether SUI can move back toward the $1.15 to $1.20 range as momentum attempts to recover.
SUI Price Holds Important Support Zone
SUI is starting to stabilize after a deep correction. The token is trading near $1.07, close to support around $1.04.
Market analysts are focused on the $1.00 to $1.04 area. This range has become important after the recent decline.
A market analyst said, “SUI is starting to stabilize after a strong correction.” The analyst added that buyers are slowly stepping back in.
The current support zone may help define the next short-term move. If buyers defend it, SUI could retest nearby resistance.
The first upside area sits between $1.15 and $1.20. Price needs to move above this range to show stronger demand.
A failure to reclaim that area could keep SUI in sideways trade. It could also lead to another test of lower support.
CoinMarketCap data shows SUI trading at $1.07, up 1.49% in 24 hours. Its market cap stands at $4.29 billion, while 24-hour volume is near $489.72 million.
SUI has a circulating supply of 4 billion tokens from a maximum supply of 10 billion.
Its fully diluted valuation is $10.72 billion, showing that supply remains important for valuation.
Deep Retracement Keeps Trend Under Pressure
The SUI/USDT daily chart shows a large retracement from its prior bull move. The measured swing runs from about $1.865 to $4.386.
SUI is now trading below the $1.865 Fibonacci retracement level. That shows the full measured rally has been retraced.
This structure remains weak while price stays below $1.86 to $1.90. That area is now a major resistance zone.
A daily close above $1.86 would change the technical picture. It would place price back inside the prior Fibonacci range.
The next Fibonacci resistance levels sit higher on the chart. These include $2.404, $2.828, $3.125, $3.423, and $3.791.
The previous high zone is near $4.386. However, those higher levels remain distant while SUI trades near $1.07.
Near-term traders are watching lower targets instead. The $1.18 to $1.20 area remains the first test for buyers.
Above that, SUI may face resistance near $1.50 to $1.60. The broader recovery level remains near $1.86 to $1.90.
Read Also:
Momentum Shows Early Recovery Attempt
Momentum readings show some improvement, but the recovery is still early. The RSI is near 52, while its moving average is near 62.
An RSI reading above 50 can show mild strength. However, the recent pullback suggests momentum has cooled after a short rebound.
The MACD is slightly bullish on the daily chart. The MACD line is above the signal line, and the histogram is positive.
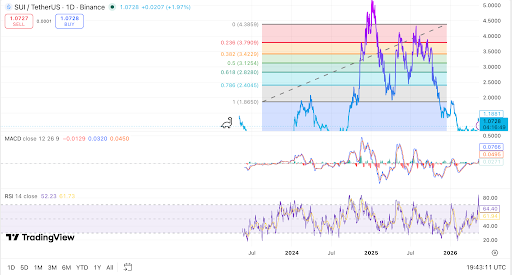 SUI holds near $1.04 support as buyers test recovery. Source: TradingView.
Still, the histogram is not large. This suggests recovery pressure is present, but not yet strong.
A bullish setup would need SUI to hold the recent base. It would also need a clear move above $1.18 to $1.20.
If that happens, SUI could target $1.50 next. A stronger recovery would need a daily close above $1.86.
The bearish case remains active if price fails near $1.20. A rejection could send SUI back toward $0.90 to $1.00.
The post SUI Price Holds Important Support Zone As Buyers Slowly Step Back In appeared first on Live Bitcoin News.


You May Also Like

Bitcoin’s Quantum Vulnerability: Poor Wallet Habits Expose 4.12 Million BTC

Rape joke by Bacolod broadcaster sparks outrage, suspension

SGX FX Partners With Chainlink to Bring OTC FX Data Onchain


Trending News
More24/7 Live News
MoreQuick Reads
More
