

Workday Stock stays bearish as bounce hits resistance near $124

Workday Stock (WDAY) stays in a bearish daily regime after Q1 optimism on new ACV and early AI traction. With price at 121.85 below key averages, bias favors tactical rallies into nearby resistance over a durable trend change.
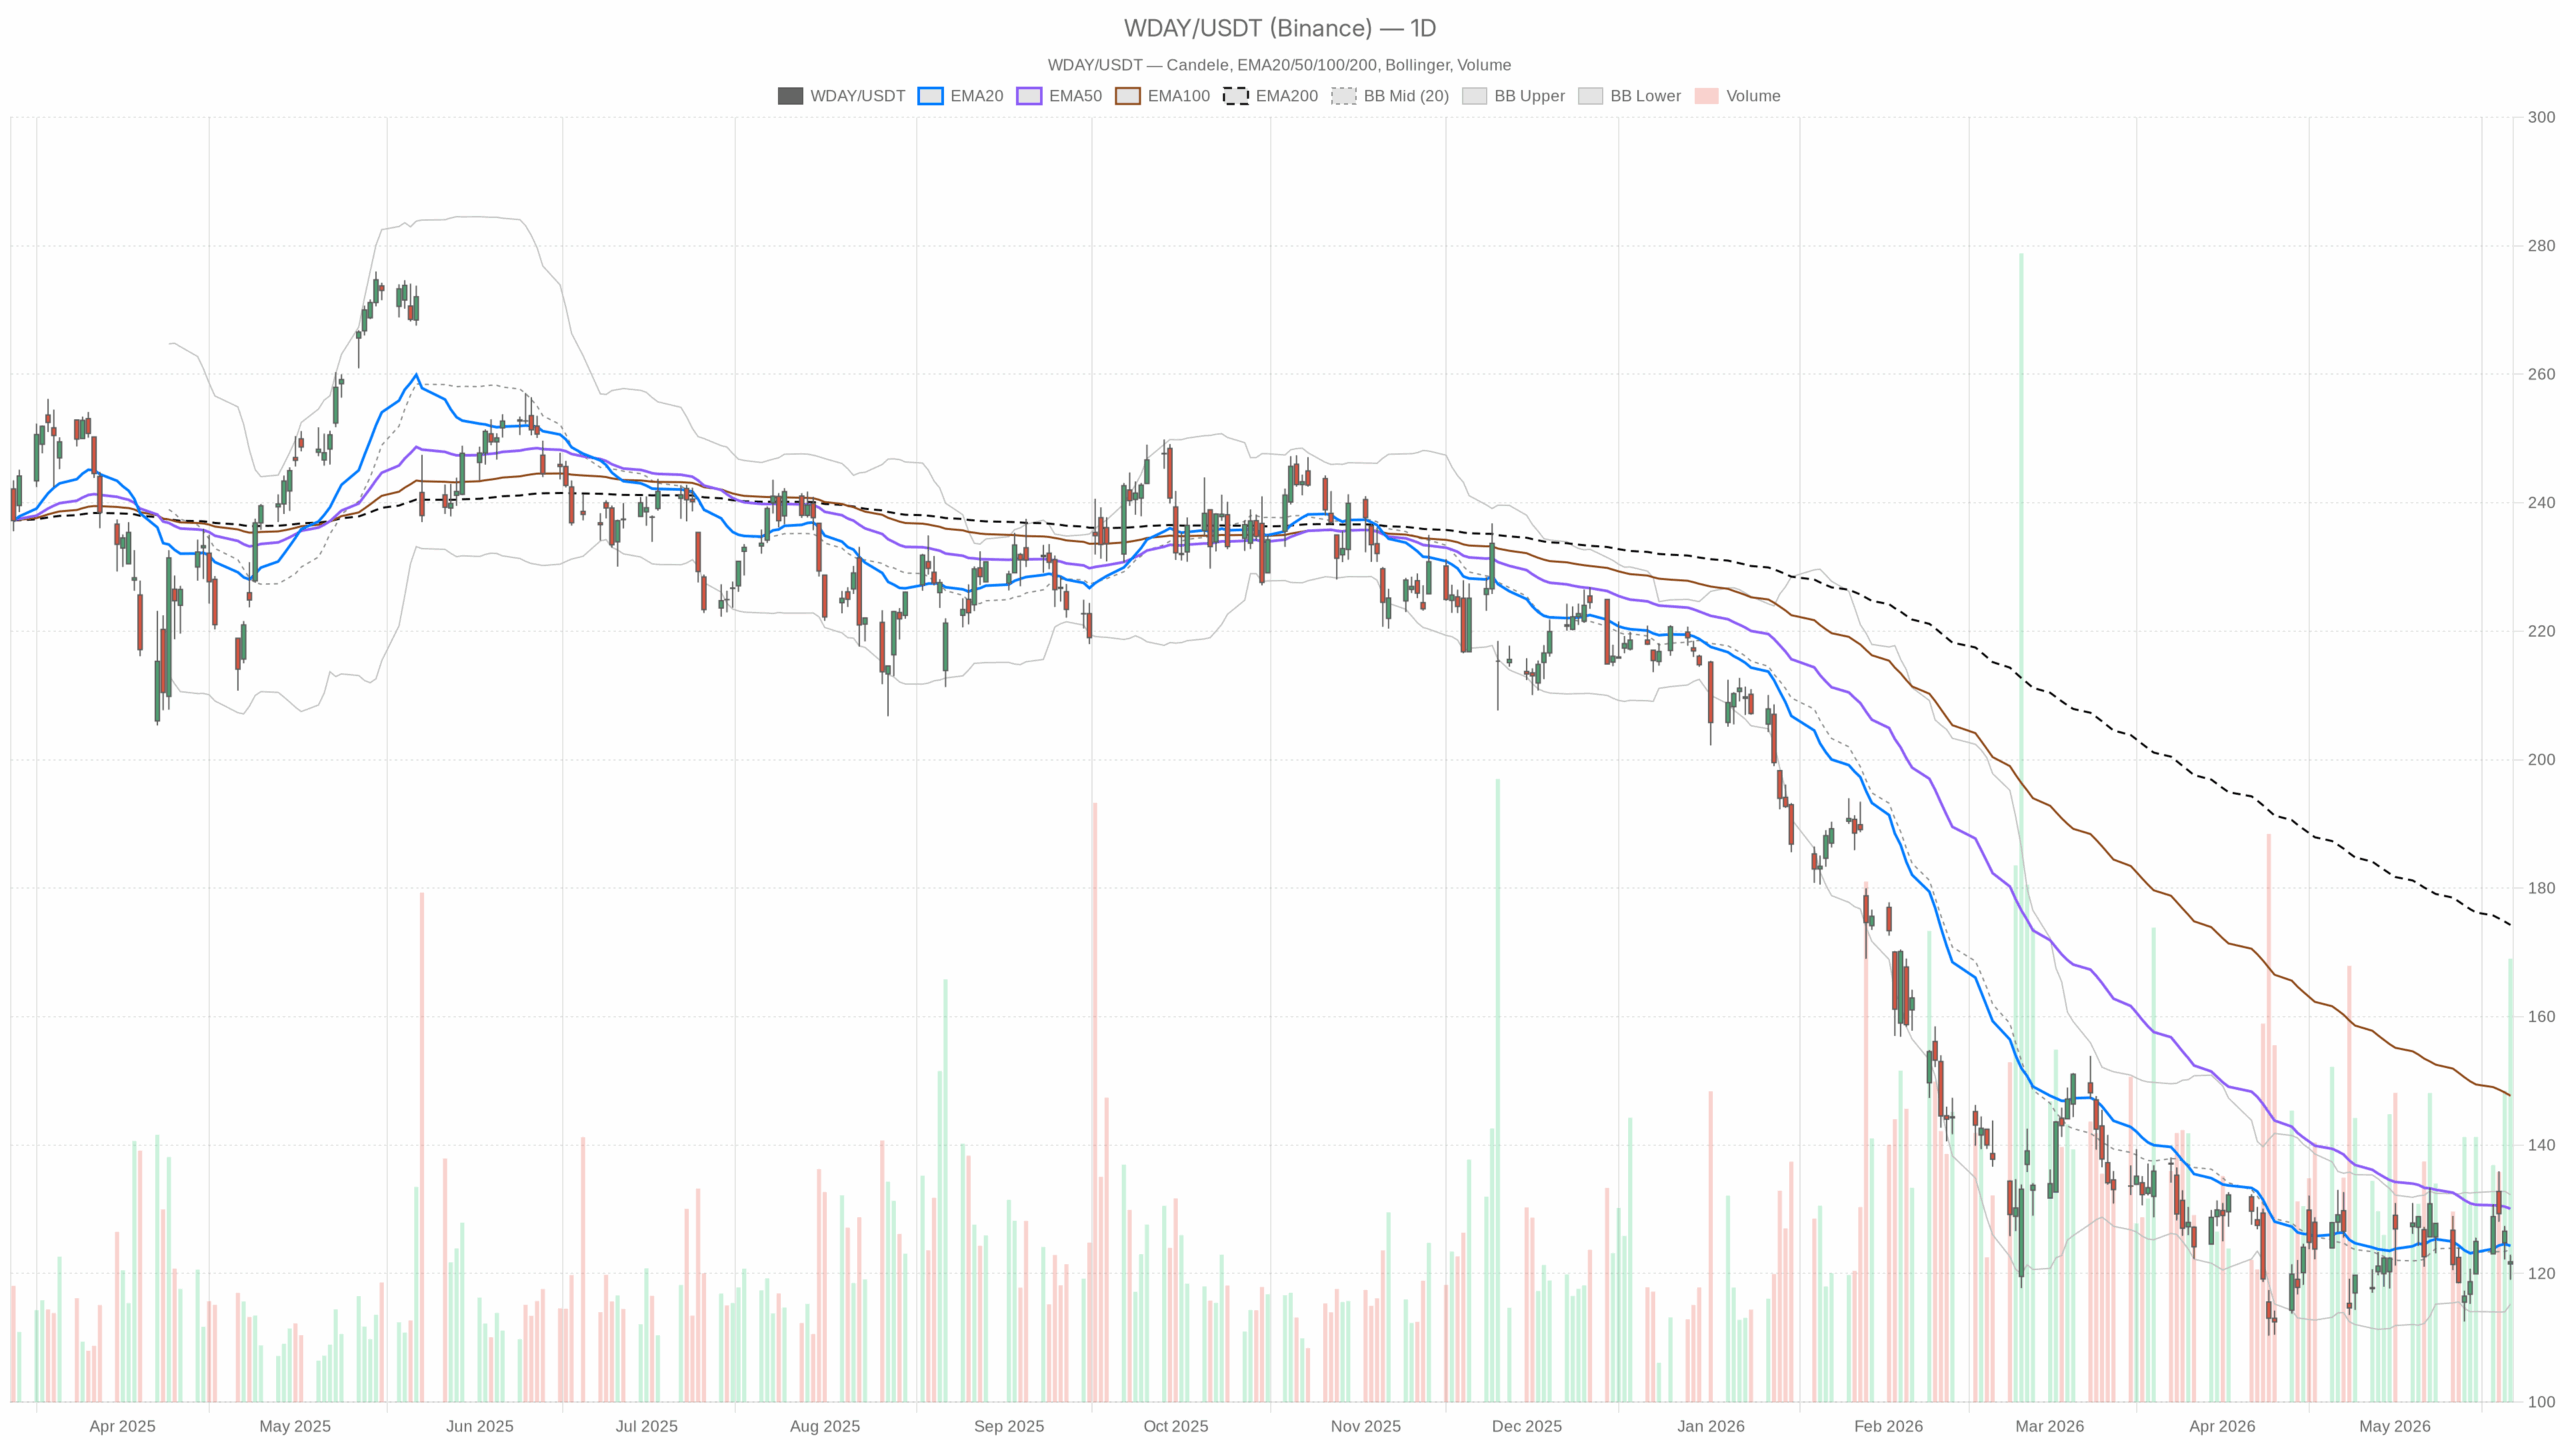 WDAY — daily chart with candlesticks, EMA20/EMA50 and volume.
Workday Stock daily technical outlook
On the daily timeframe, WDAY closed beneath the 20‑day EMA at 124.34 and the 50‑day at 130.10. It also remains well under the 200‑day at 174.28. The trend backdrop is therefore negative, with supply capping rebounds.
Daily momentum and volatility context
The daily RSI(14) sits at 46.69, which is subdued but not oversold. Meanwhile, MACD reads line -0.42 versus signal -0.92, with a +0.50 histogram. Downside momentum is easing, yet the trend has not flipped bullish.
Daily Bollinger Bands center on 123.78, with the upper band at 132.31 and the lower at 115.25. Price trades below the mean, occupying the lower half of the envelope without reaching extremes. The ATR(14) is 7.02, so realized volatility is elevated. Daily pivots place PP at 121.28, R1 at 123.52, and S1 at 119.61. The close just above PP keeps 121.28 as first support, with 123.52 the immediate ceiling.
Intraday 1-hour view: WDAY under pressure
On the 1‑hour chart, price sits below the 20/50/200‑hour EMAs at 124.13/124.42/124.54. That cluster makes the 124 area a heavy supply zone. Hourly RSI(14) at 41.13 signals weak momentum, consistent with sellers fading bounces. The hourly MACD shows the line at -1.25 under the signal at -0.49, with a -0.76 histogram. Short‑term impulse remains negative.
The hourly Bollinger mid is 125.59, and price remains beneath it, so mean‑reversion attempts face resistance above. The 1‑hour ATR(14) is 2.30, keeping swings active but orderly. The hourly pivot sits at 121.48, with price near 121.89. PP acts as nearby support, while the path higher stays crowded with resistance.
15-minute execution context for Workday Stock
On the 15‑minute view, price hovers around the EMA20 at 121.90, while the EMA50 at 123.50 and EMA200 at 124.34 remain overhead. A modest intraday bounce is underway into layered resistance.
The 15‑minute RSI(14) prints 47.06, keeping momentum neutral to soft. MACD shows a small positive histogram at +0.22, yet the line at -0.60 is still below the signal at -0.82. That is a micro‑bullish inflection, not a confirmed shift.
Bollinger mid on 15‑minute stands at 121.37 with the upper band at 122.42. Price leans toward the top of its envelope, which raises near‑term pullback risk unless it breaks through. The 15‑minute ATR(14) is 0.84, so micro ranges are moderate. The 15‑minute pivot is 121.72 with R1 at 122.16. The 121.70–122.20 zone is the immediate battleground for momentum traders.
Range and volatility frame for WDAY
Notably, the broader range is framed by the daily Bollinger Bands from 115.25 to 132.31, alongside ATR at 7.02. Volatility is high enough to test multiple levels in a session. The daily S1 at 119.61 and the upper reference near 123.52–124.34 define near‑term risk and reward. Whipsaws are likely inside this corridor until a decisive break.
Fundamentals and sentiment
In the background, Workday’s Q1 FY27 call highlighted renewed momentum in new ACV, ongoing customer expansion, and early AI product traction. However, Cantor Fitzgerald trimmed its price target from 200 to 160 this week. Together, these headlines help floor sentiment but have not yet flipped the technical trend.
Bullish validation above 123–124
For a bullish turn, the stock needs to reclaim and hold above 123.52 (daily R1). It should then clear the 20‑day EMA at 124.34, which coincides with the 1‑hour EMA cluster around 124. A sustained close above 124 would signal improving trend quality and open a run toward 126–130. On confirmation, hourly RSI should push back above 50 and MACD should cross positive. That would validate momentum follow‑through beyond a simple bounce.
Bearish continuation below 121–119
On the other hand, failure to clear 122–124 followed by a loss of 121.28 (daily PP) would keep bears in control. That break would expose 119.61 (daily S1) and the lower daily band at 115.25. A break under 119.61 would invalidate the near‑term bullish setup and re‑accelerate the downtrend. A rollover in the daily MACD histogram back toward zero would add to downside risk.
Bottom line
Overall, positioning around Workday Stock should respect the bearish daily bias and the crowded resistance stack near 123–125, with ATR signaling larger‑than‑usual swings. Therefore, expect choppy tape and false starts until the 124 area is decisively recaptured or 119 breaks. Until then, tactical trades can work, but conviction trends remain unproven.


You May Also Like

Safe Havens Are Failing — Why Gold, Silver, and Crypto Are All Falling Together

Zcash Privacy Explained: Shielded vs. Transparent ZEC, Supported Wallets & More

Trump plot to kill midterm voting machines collapses as aide finds zero evidence: report


