

BTC/USDT Spot CVD Chart Analysis: Volume Heatmap and Order Flow Insights as of May 25
BitcoinWorld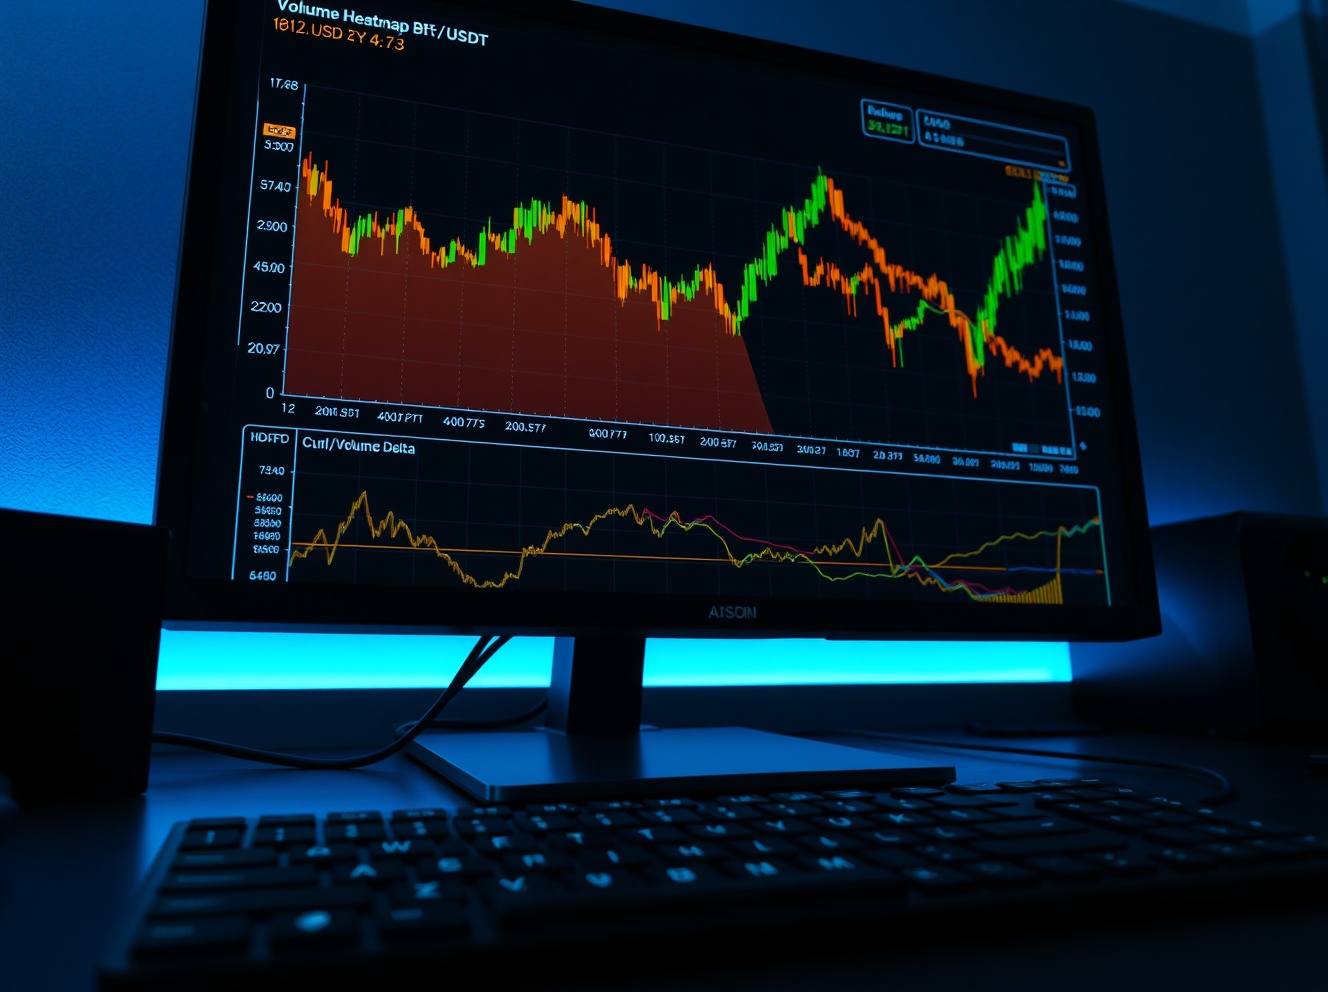
BTC/USDT Spot CVD Chart Analysis: Volume Heatmap and Order Flow Insights as of May 25
As of 10:00 a.m. UTC on May 25, 2025, the BTC/USDT spot pair is showing notable activity in its order book, as visualized by the Spot Cumulative Volume Delta (CVD) chart. This chart provides traders with a granular view of buying and selling pressure at different price levels and trade sizes.
Understanding the Volume Heatmap
The top section of the chart features a Volume Heatmap, which tracks the volume of trades executed at specific price points. In this heatmap, the background color becomes brighter in price ranges where the price lingers or moves significantly. These brighter areas can act as potential support or resistance levels, as they represent zones where substantial trading activity has occurred. For traders, identifying these zones can help in anticipating where the price might react in the near term.
Cumulative Volume Delta (CVD) Breakdown
The bottom section of the chart displays the Cumulative Volume Delta (CVD) indicator, which categorizes buy and sell orders by trade size. As buy orders increase, the corresponding colored line rises, providing a clear visual of order flow dynamics. For instance, the yellow line tracks orders between $100 and $1,000, representing smaller retail trades. The brown line, in contrast, represents large orders ranging from $1 million to $10 million, often associated with institutional activity. The divergence or convergence of these lines can signal shifts in market sentiment.
Implications for Traders
This chart is particularly useful for intraday traders and scalpers who rely on order flow analysis to make informed decisions. By monitoring the CVD, traders can gauge whether buying or selling pressure is dominant at a given moment. A rising CVD line for large orders (brown line) could indicate institutional accumulation, while a declining line might suggest distribution. The Volume Heatmap adds an extra layer of context, highlighting price levels where significant volume has already been traded.
Conclusion
The BTC/USDT spot CVD chart as of May 25 offers a detailed snapshot of current market dynamics. By combining the Volume Heatmap with the CVD indicator, traders can identify key support and resistance zones and assess the strength of buying or selling pressure. This analysis remains a valuable tool for short-term trading strategies, though it should be used alongside other technical and fundamental indicators for a comprehensive view.
FAQs
Q1: What is the Cumulative Volume Delta (CVD) indicator?
The CVD indicator tracks the cumulative difference between buying and selling volume, categorized by trade size. It helps traders understand whether buying or selling pressure is dominant at a given time.
Q2: How does the Volume Heatmap work?
The Volume Heatmap displays the volume of trades at specific price levels. Brighter colors indicate higher trading activity, which can act as potential support or resistance zones.
Q3: Why are large orders (brown line) significant?
The brown line represents orders between $1 million and $10 million, often associated with institutional investors. Changes in this line can signal large-scale accumulation or distribution, influencing market direction.
This post BTC/USDT Spot CVD Chart Analysis: Volume Heatmap and Order Flow Insights as of May 25 first appeared on BitcoinWorld.


You May Also Like

Consumer Mood Drops Near Historic Low While Bitcoin Holds Firm

Metaplanet Stock Passes MARA to Become Third-Largest BTC Holder — Stock Slips Anyway

Dogecoin and Hyperliquid Are Heating Up — But This New Project Might Be the One to Watch



