-
Render price surged over 18% in 24 hours, reclaiming $2.25 for the first time in nearly four months.
-
On-chain activity hit a 12-week high, signaling renewed whale accumulation and network growth.
-
Futures volume exploded 166% while open interest jumped 61%, fueling speculation of a larger breakout toward $3 and beyond.
Render price rally has suddenly returned to the center of market attention after token price surged more than 18% today, breaking above a key resistance zone and recording its strongest recovery move in months. The sharp rally came as on-chain activity climbed to a 12-week high, whale participation accelerated, and derivatives traders rushed back into the market with aggressive positioning. With momentum building rapidly, traders are now watching whether this breakout has enough strength to trigger a sustained trend reversal or if Render price is setting up for another volatile rejection
Whale Activity and Network Growth Trigger Fresh Momentum
Render’s rally appears to be driven by a combination of rising network participation, increasing whale activity, and stronger speculative demand, creating one of the strongest bullish setups the token has seen in recent months.
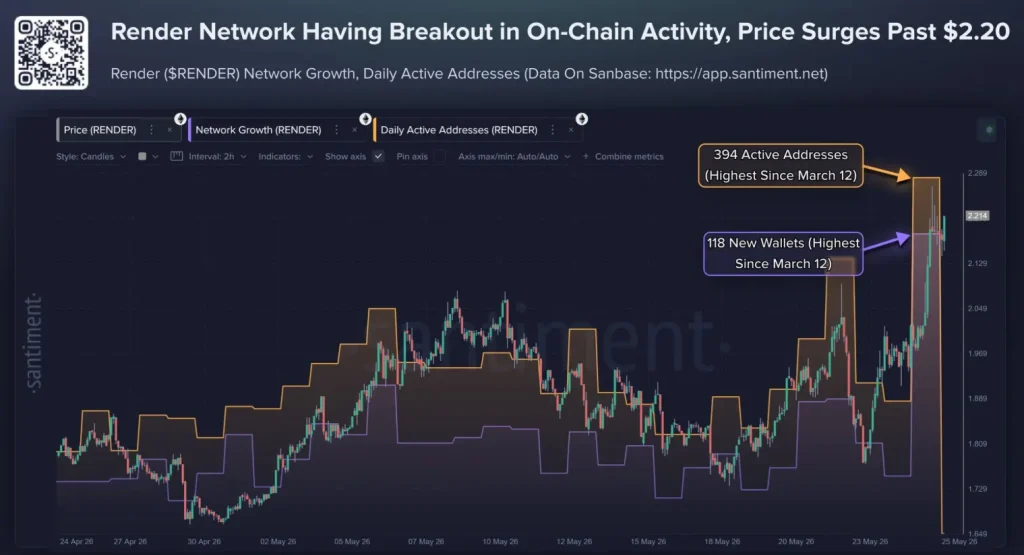
According to fresh on-chain data, Render Network activity recently climbed to its highest level in nearly 12 weeks, with daily active addresses and wallet growth accelerating sharply as RNDR reclaimed levels above $2.25. The increase in activity coincided with price expansion, a signal traders often view as confirmation that a rally is being supported by actual network engagement rather than short-term speculation alone.
This development matters because rising activity on a blockchain network often signals improving utility and stronger investor confidence. When price appreciation is supported by increasing participation, markets tend to treat the move as structurally stronger than rallies fueled only by leverage or momentum trading.
Whale activity has also started attracting attention. Large transaction flows increased as RNDR pushed through major resistance, suggesting bigger market participants may be positioning for a broader recovery move. Historically, whale accumulation phases have often preceded stronger trend continuation in mid-cap crypto assets, particularly when combined with rising network demand. That combination of stronger fundamentals and improving market sentiment appears to be fueling the latest move higher.
RNDR Futures Volume Explodes 166% as Traders Rush Into the Rally
The bullish momentum is also becoming visible across derivatives markets. According to futures market data, Render futures volume surged 166.31% to $368.57 million in the last 24 hours, while open interest jumped 61.90% to $124.61 million, signaling a sharp increase in trader participation.

The spike in derivatives activity suggests fresh capital is entering the market rather than existing traders merely rotating positions. When both price and open interest rise together, markets often interpret the move as confirmation that traders are opening new bullish positions instead of simply closing old ones. That dynamic tends to strengthen momentum because it reflects rising conviction behind the trend.
At the same time, the surge in leveraged positioning also introduces volatility risks. Sharp increases in open interest can accelerate liquidation-driven price swings if momentum slows or resistance levels trigger profit-taking. However, for now, derivatives positioning appears to support the bullish structure rather than weaken it.
Render Price Breakout Signals Bigger Rally Ahead
RNDR price action is beginning to show signs of a larger structural reversal. The daily chart suggests Render recently completed a double-bottom formation, a pattern commonly associated with trend reversals after prolonged downtrends. More importantly, RNDR has now broken above a descending trendline that capped price action for months, allowing bulls to reclaim short-term momentum.
The latest breakout also comes with rising volume, which strengthens the credibility of the move. RNDR is currently attempting to establish support above the $2.20 breakout zone, while bulls are targeting the $2.60–$2.80 resistance range, an area that previously rejected price during earlier recovery attempts. A successful move above that zone could open the door for a stronger rally toward $3.20, while a sustained breakout may eventually place the broader $5.00–$5.50 resistance area back into focus.
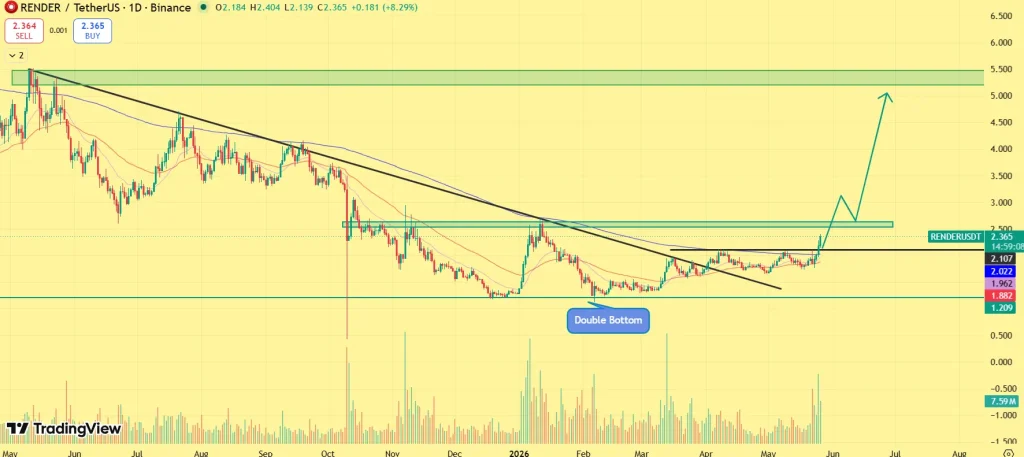
However, failure to hold above the recent breakout region could slow momentum and trigger short-term consolidation before another upward attempt. On the downside, traders are closely watching the $2.10–$2.20 region, which now acts as immediate support following the breakout. Holding this level could strengthen bullish momentum and confirm buyer control. On the upside, $2.60–$2.80 remains the first major resistance zone, with a decisive breakout above that level potentially accelerating gains toward $3.20 and eventually $5.00+ if buying pressure continues to build.
Can Render Keep the Rally Alive?
Render’s rally is beginning to look more than a short-term spike. Rising whale activity, a surge in network participation, and explosive futures positioning suggest bulls are attempting to reclaim control after months of weakness. However, the next move depends on whether RNDR can firmly hold above $2.20 support and break through the $2.60–$2.80 resistance zone. If momentum persists, traders could soon start positioning for a broader move toward $3 and beyond.