

Liquidity Wave Extends The Crypto Bull Run Into 2026, Predicts Raoul Pal
Raoul Pal believes the crypto cycle is not nearing a peak but entering a longer, more powerful expansion that can run well into 2026, driven by a global liquidity uptrend tied to government debt dynamics. In a special Sept. 25 “Everything Code” masterclass with Global Macro Investor (GMI) head of macro research Julien Bittel, the Real Vision co-founder laid out a tightly interlocked framework connecting demographics, debt, liquidity and the business cycle to asset returns—arguing that crypto and tech remain the only asset classes structurally capable of outpacing what he calls the hidden debasement of fiat.
Everything Code: Liquidity Is Crypto’s Master Switch
“The biggest macro variable of all time,” Pal said, “is that global governments and central banks are increasing liquidity to manage debt at 8% a year.” He separated that ongoing debasement from measured inflation, warning investors to think in hurdle rates, not headlines: “You’ve got an 11% hurdle rate on any investment that you have. If your investments are not hitting 11% you are getting poorer.”
Pal and Bittel’s “Everything Code” starts with trend GDP as the sum of population growth, productivity and debt growth. With working-age populations declining and productivity subdued, public debt has filled the gap—structurally lifting debt-to-GDP and hard-wiring the need for liquidity.
“Demographics are destiny,” Pal said, pointing to a falling labor-force participation rate that, in GMI’s work, mirrors the inexorable rise in government debt as a share of GDP. The bridge between the two, they argue, is the liquidity toolkit—balance sheets, the Treasury General Account (TGA), reverse repos and banking-system channels—deployed in cycles to finance interest costs that the economy cannot organically bear. “If trend growth is ~2% and rates are 4%, that gap has to be monetized,” Pal said. “It’s a story as old as the hills.”
Bittel then mapped what he called the “dominoes.” GMI’s Financial Conditions Index—an econometric blend of commodities, the dollar and rates—leads total liquidity by roughly three months; total liquidity leads the ISM manufacturing index by about six months; and the ISM, in turn, sets the tone for earnings, cyclicals and crypto beta. “Our job is to live in the future,” Bittel said. “Financial conditions lead the ISM by nine months. Liquidity leads by six. That sequence is what risk markets actually trade.”
In that sequence, crypto is not an outlier but a high-beta macro asset. “Bitcoin is the ISM,” Bittel said, noting that the same diffusion-index dynamics that govern small-cap equities, cyclicals, crude and emerging markets also map onto BTC and ETH.
As the cycle accelerates from sub-50 ISM toward the high-50s, risk appetite migrates down the curve: first from BTC into ETH, then into large alternative L1s and, only later, into smaller caps—coinciding with falling BTC dominance. Pal cautioned investors who expect “instant altseason” that they are fighting the phasing of the real economy: “It always goes into the next safest asset first… only when the ISM is really pushing higher and dominance is falling hard do you get the rest.”
Part of the recent “sideways chop,” they argued, reflected a sharp TGA rebuild—an exogenous liquidity drain that disproportionately impacts the far end of the risk curve. Bittel highlighted that the $500 billion rate of change since mid-July effectively removed fuel that otherwise would have buoyed crypto prices, while stressing that the drain is nearing an inflection.
He also flagged DeMark timing signals pointing to a reversal in the TGA’s contribution to net liquidity. “That should now reverse and work lower into year-end, which then will drive our liquidity composites higher,” he said, adding that the People’s Bank of China’s balance sheet at all-time highs has partially offset US drags.
Against that backdrop, the pair contend that the forthcoming 12 months are critical. “We’ve got $9 trillion of debt to roll over the next 12 months,” Pal said. “This is the 12 months where maximum money printing comes.” Their base case has policy rates moving lower into a still-subdued but improving cycle, with central banks focused on lagging mandates—unemployment and core services inflation—while early-cycle inflation breadth remains contained. Bittel underscored the sequencing inside inflation itself: commodities first, then goods, with shelter disinflation mechanically lagging, giving central banks cover to cut even as growth accelerates.
The implication for portfolio construction, Pal argued, is radical. “Diversification is dead. The best thing is hyper-concentration,” he said, framing the choice not as a taste for volatility but as arithmetic survival against debasement. In GMI’s long-horizon tables, most traditional assets underperform the combined debasement-plus-inflation hurdle, while the Nasdaq earns excess returns over liquidity and Bitcoin dwarfs both. “What is the point of owning any other asset?” Pal asked rhetorically. “This is the super-massive black hole of assets, which is why we personally are all-in on crypto… It’s the greatest macro trade of all time.”
Bittel overlaid Bitcoin’s log-regression channel—what Pal called the “network adoption rails”—on the ISM to illustrate how time and cycle amplitude interact. Because adoption drifts price targets higher through time, longer cycles mechanically point to higher potential outcomes. He showed illustrative channel levels tied to hypothetical ISM prints to explain the mechanism, from mid-$200Ks if the ISM rises into the low-50s to materially higher if the cycle extends toward the low-60s. The numbers were not presented as forecasts but as a map for how cycle strength translates into range-bound fair value bands.
Macro Liquidity Extends The Crypto Bull Run
Critically, Pal and Bittel argued the current cycle differs from 2020–2021, when both liquidity and the ISM peaked in March 2021, truncating the run. Today, they say, liquidity is re-accelerating into the debt-refinancing window and the ISM is still below 50 with forward indicators pointing up, setting up a 2017-style Q4 impulse with seasonal tailwinds—and, unlike 2017, a higher probability that strength spills into 2026 because the refinancing cycle itself has lengthened. “It is extremely unlikely that it tops this year,” Pal said. “The ISM just isn’t there, and global liquidity isn’t either.”
The framework also locates crypto within a broader secular S-curve. Pal contrasted fiat debasement, which lifts asset prices, with GDP-anchored earnings and wages, which lag—explaining why traditional valuation optics look stretched and why owning long-duration, network-effect assets becomes existential.
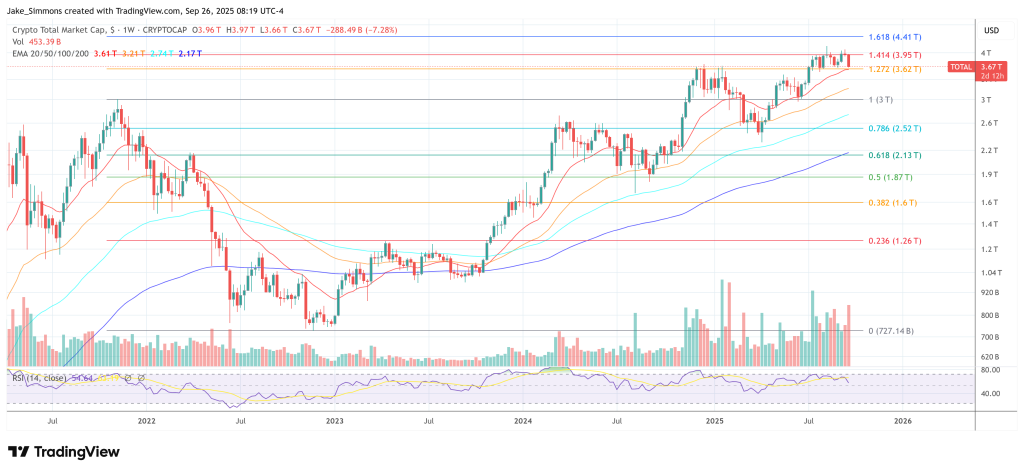
He placed crypto’s user growth at roughly double the internet’s at a comparable stage and argued that tokens uniquely allow investors to own the infrastructure layer of the next web. On total addressable value, he applied the same log-trend framing to the entire digital asset market, sketching a path from roughly $4 trillion today toward a potential $100 trillion by the early 2030s if the space tracks its “fair value” adoption channel, with Bitcoin ultimately occupying a role analogous to gold inside a much larger digital asset stack.
Pal closed with operational advice consistent with a longer, liquidity-driven expansion: maintain exposure to proven, large-cap crypto networks, avoid leverage that forces capitulation during routine 20–30% drawdowns, and match time horizon to the macro clock rather than headlines. “We’re four percent of the way there,” he said. “Your job is to not mess this up.”
At press time, the total crypto market cap stood at $3.67 trillion.
You May Also Like

X money beta expands with 6% yield and cashback in beta

Crucial US Stock Market Update: What Wednesday’s Mixed Close Reveals
