

Palantir Holds Near $137 as Daily Downtrend Still Caps the Stock

Palantir stock is stabilizing near the mid-$130s after a sharp run and pullback. The bias remains cautious as the daily trend stays down, yet short-term action shows buyers probing for control into a tight holiday week.
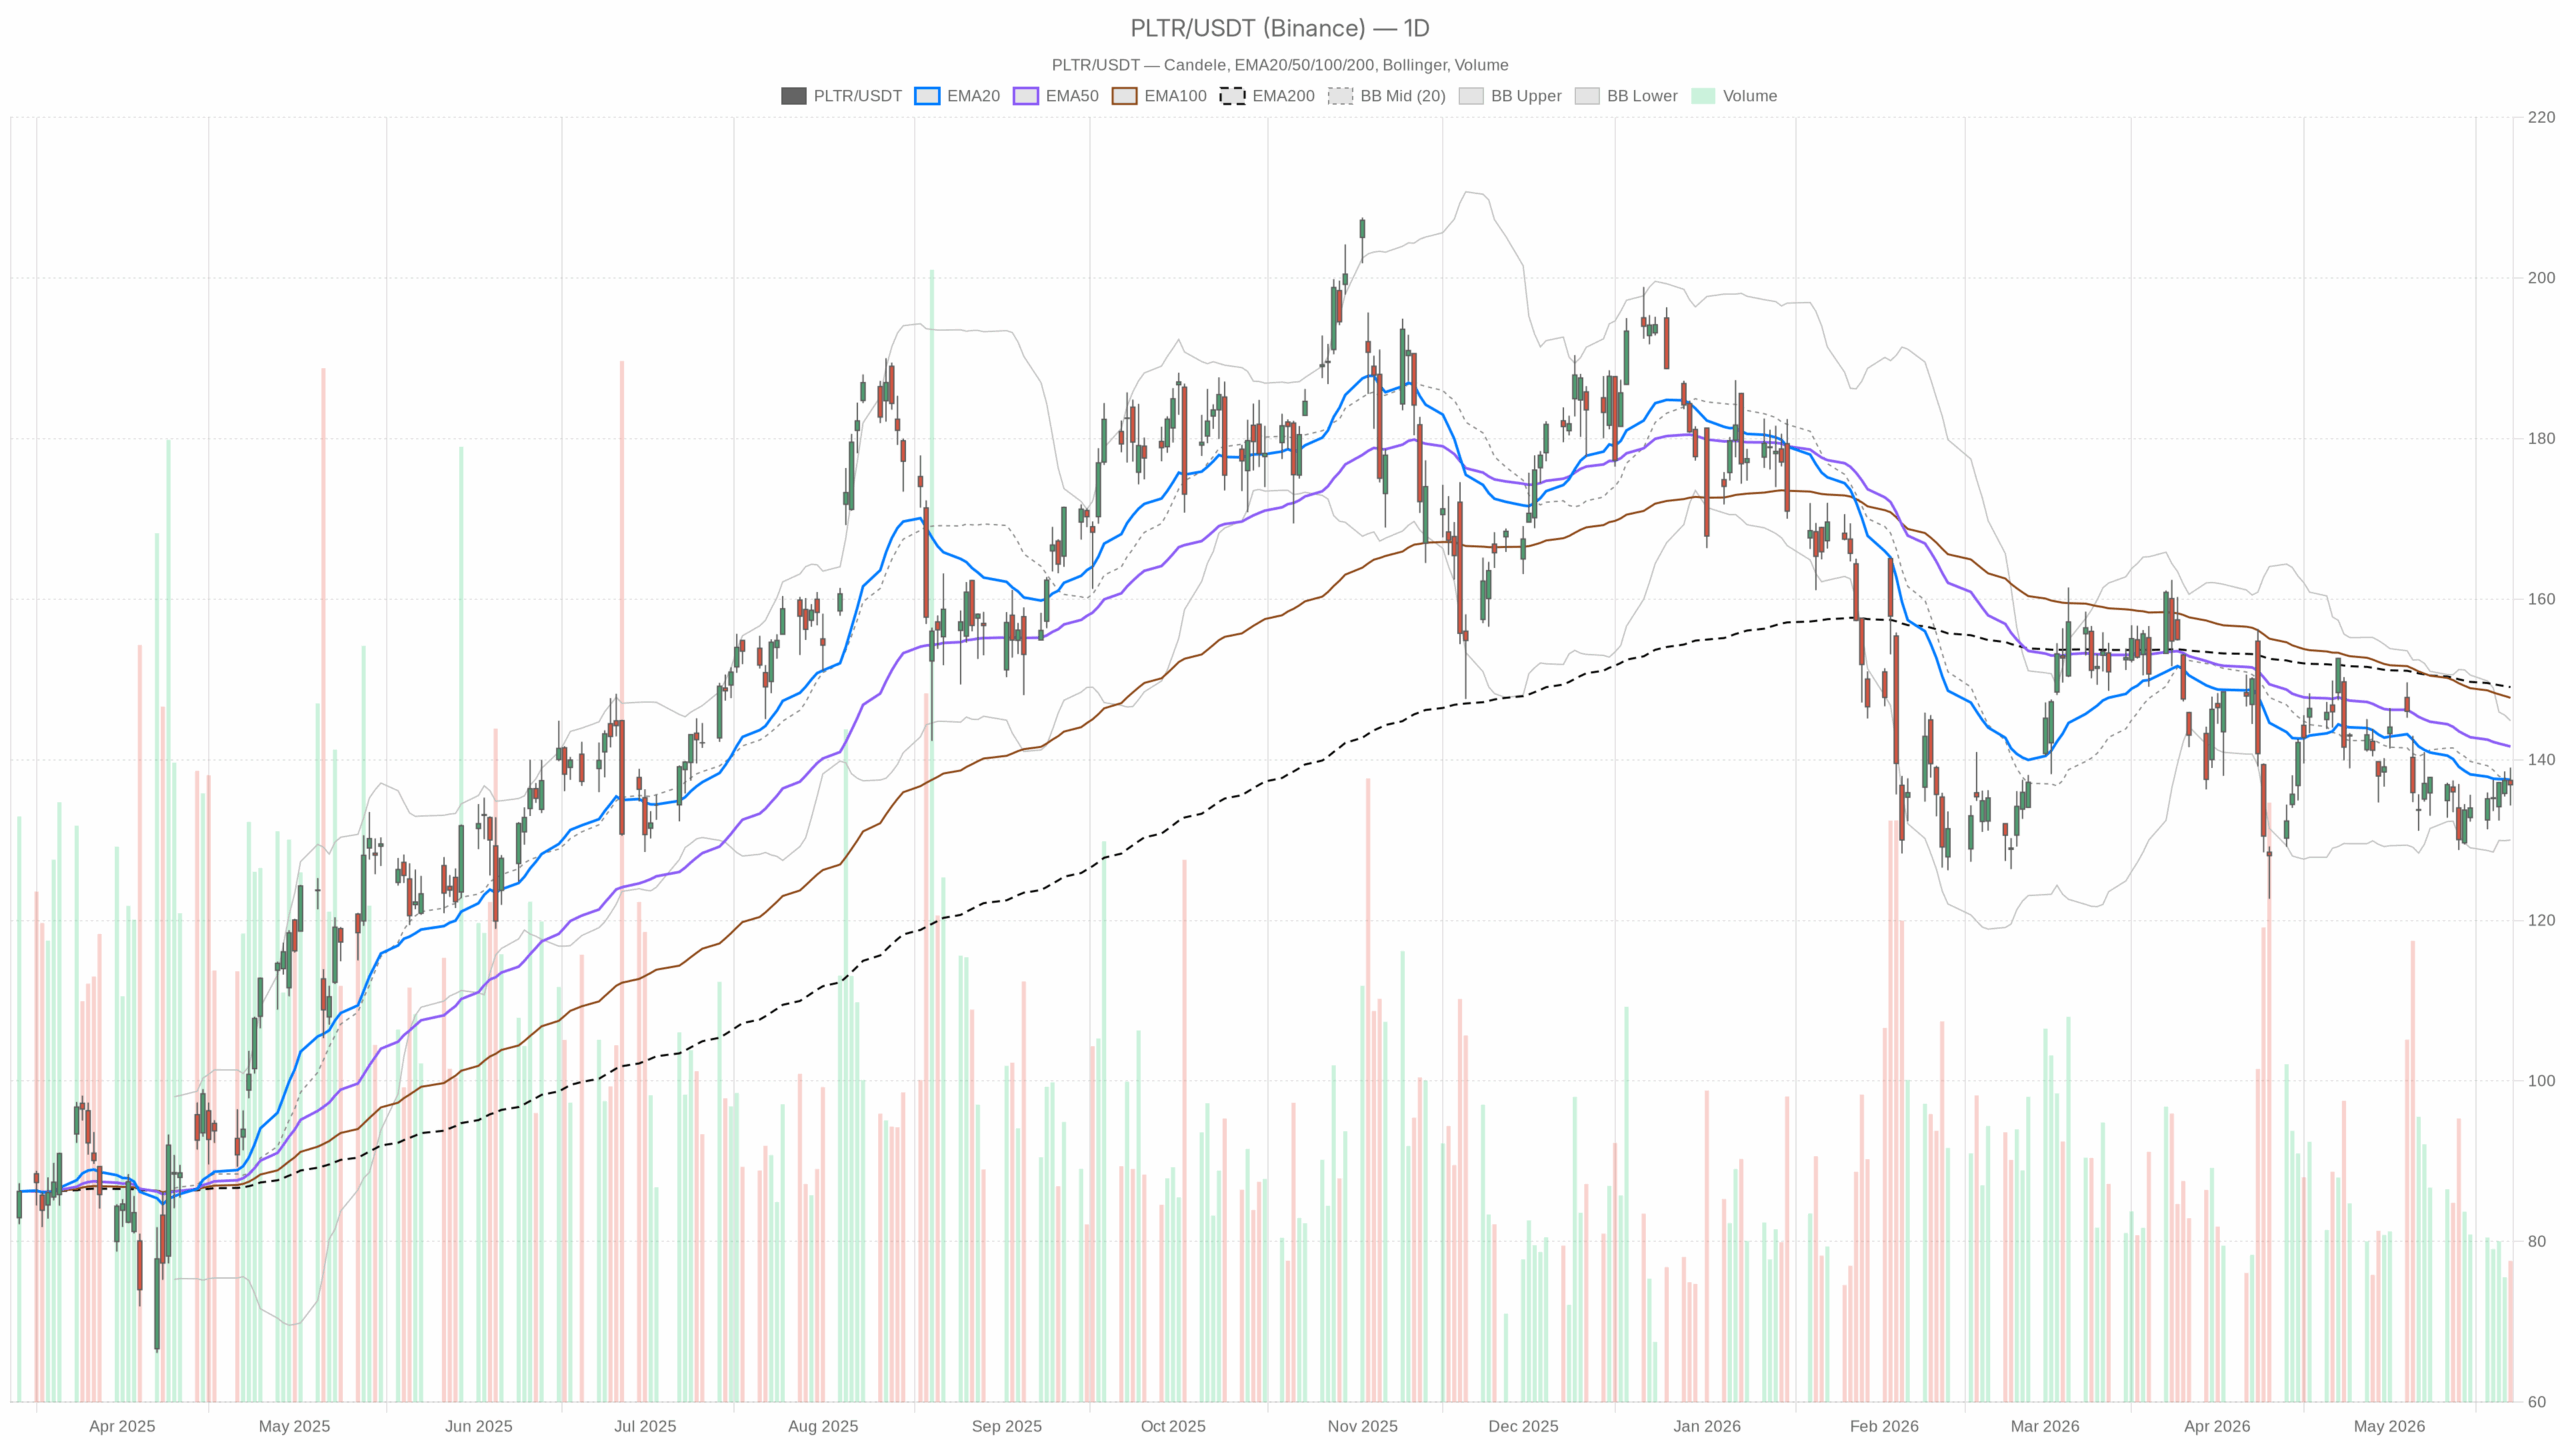 PLTR — daily chart with candlesticks, EMA20/EMA50 and volume.
Palantir Daily Technical Outlook: Bias Still Cautious
However, the daily setup keeps the burden on the bulls. Price closed at 136.88, fractionally below the 20-day EMA at 137.51 — sellers still have a near-term edge. The 50-day EMA at 141.64 and the 200-day EMA at 149.05 sit well above price. The broader trend is down, with layered resistance overhead.
Momentum and Volatility Signals
Notably, RSI-14 at 47.49 shows momentum below neutral and lacking thrust. MACD line -1.85 vs. signal -2.21 with a +0.36 histogram suggests a mild positive inflection, but conviction is tentative. Bollinger Bands center at 137.43 with upper 144.85 and lower 130.00 — price is near the midline, and volatility is contained inside a broad $15 band.
Meanwhile, ATR-14 at 5.35 implies moderate daily swings for a name of this size. The daily pivot sits at 136.73 with R1 at 139.17 and S1 at 134.45 — price is hovering around the pivot with defined edges for the next move.
Palantir Headlines and Sentiment
Meanwhile, headlines lean constructive even as the chart lags. Recent coverage highlighted strong Q1 growth and profitability (per Seeking Alpha), alongside debate over upside in an “agentic AI” cycle (Motley Fool). Cantor Fitzgerald reiterated a Neutral with a $138 target (Yahoo Finance) — sentiment is improving, but near-term expectations look anchored near current price.
Intraday Structure: 1-Hour Chart for PLTR
At the same time, the 1-hour chart shows stabilization but not a trend change. Price closed at 136.80 with the 20-EMA at 136.50 and the 50-EMA at 135.80 — intraday bias tilts slightly higher. The 200-EMA at 138.61 is the first serious cap on any bounce.
RSI-14 at 53.45 signals a modest bullish tilt, but not a surge. MACD line 0.50 vs. signal 0.60 with a -0.10 histogram points to momentum pausing after a small pop. Bollinger mid 136.74 with bands 135.16–138.32 marks a tight range that favors mean reversion near 137. ATR-14 at 1.50 keeps intraday volatility contained. The hourly pivot is 136.89, with R1 at 137.06 and S1 at 136.63 — the tape is balanced just under resistance.
15-Minute Tape: Execution Context
Notably, the 15-minute tape offers clean execution context but little directional edge. Price at 136.80 sits on the 50-EMA at 136.80 and just below the 20-EMA at 136.96 — micro-bias is flat to slightly heavy. The 200-EMA at 135.76 marks deeper support on dips.
In contrast, RSI-14 at 48.28 shows neutral momentum. MACD line 0.06 vs. signal 0.05 with a flat histogram keeps momentum balanced. Bollinger mid 136.88 with bands 136.14–137.62 encourages fade setups near the edges. ATR-14 at 0.46 reflects a very tight tape. The 15-minute pivot is 136.87, with R1 at 137.00 and S1 at 136.67 — price is coiled around the pivot for short bursts.
Bullish Path: What Bulls Must Reclaim on Palantir
Therefore, the constructive path for bulls starts with a sustained reclaim of nearby resistance and a handoff to the daily timeframe:
- A push above the hourly 200-EMA at 138.61 — the first step toward control.
- A daily close through 139.17 (R1) and then 141.64 (the 50-day EMA) — a signal of a more durable reversal.
- Daily RSI pressing through 50–55 — confirmation of improving momentum.
- A MACD histogram that builds further above zero on the daily — evidence of follow-through.
- A drift toward the Bollinger upper band near 144.85 with expanding ATR — indication of trend acceleration rather than chop.
Bearish Path: Levels That Hand Control Back to Sellers in Palantir
On the other hand, the bearish path remains straightforward while the daily downtrend holds:
- Failure near 137–139 followed by a break under 136.63 (hourly S1) — a handoff back to sellers.
- A daily move below 134.45 (S1) — opens a test of the 130.00 lower Bollinger band.
- Daily RSI slipping toward the low 40s — signals momentum rolling over again.
- A daily MACD turn lower with a negative histogram — confirms downside pressure.
- Rising ATR on red sessions — flags expansion to the downside, not just noise.
Palantir Outlook: Tactical Decision Point
Overall, Palantir sits at a tactical decision point: intraday firmness versus a still-bearish daily trend. Until price reclaims 138.6–141.6 and holds, expect choppy mean reversion around the 136–137 pivot zone. Position sizing and timing matter, as intraday volatility is compressed but can expand quickly on breaks.


You May Also Like

Bitcoin, Gold, and U.S. Stocks Dive as Trump Pledges to Hit Iran ‘Extremely Hard’

Best Mobile User Retention Tools in 2026

GMatrixs Partners With InsightX To Advance GameFi User Experiences With AI-Powered Web3 Prediction Market Ecosystem



