

IREN Stock Holds Its Uptrend, But $60–61 Is the Key Test

IREN Stock remains in a daily uptrend but is stalling beneath tight 60–61 resistance. The hourly structure supports the advance, while 15‑minute action coils under round numbers. Therefore, the next impulse likely hinges on a decisive breakout above immediate pivots.
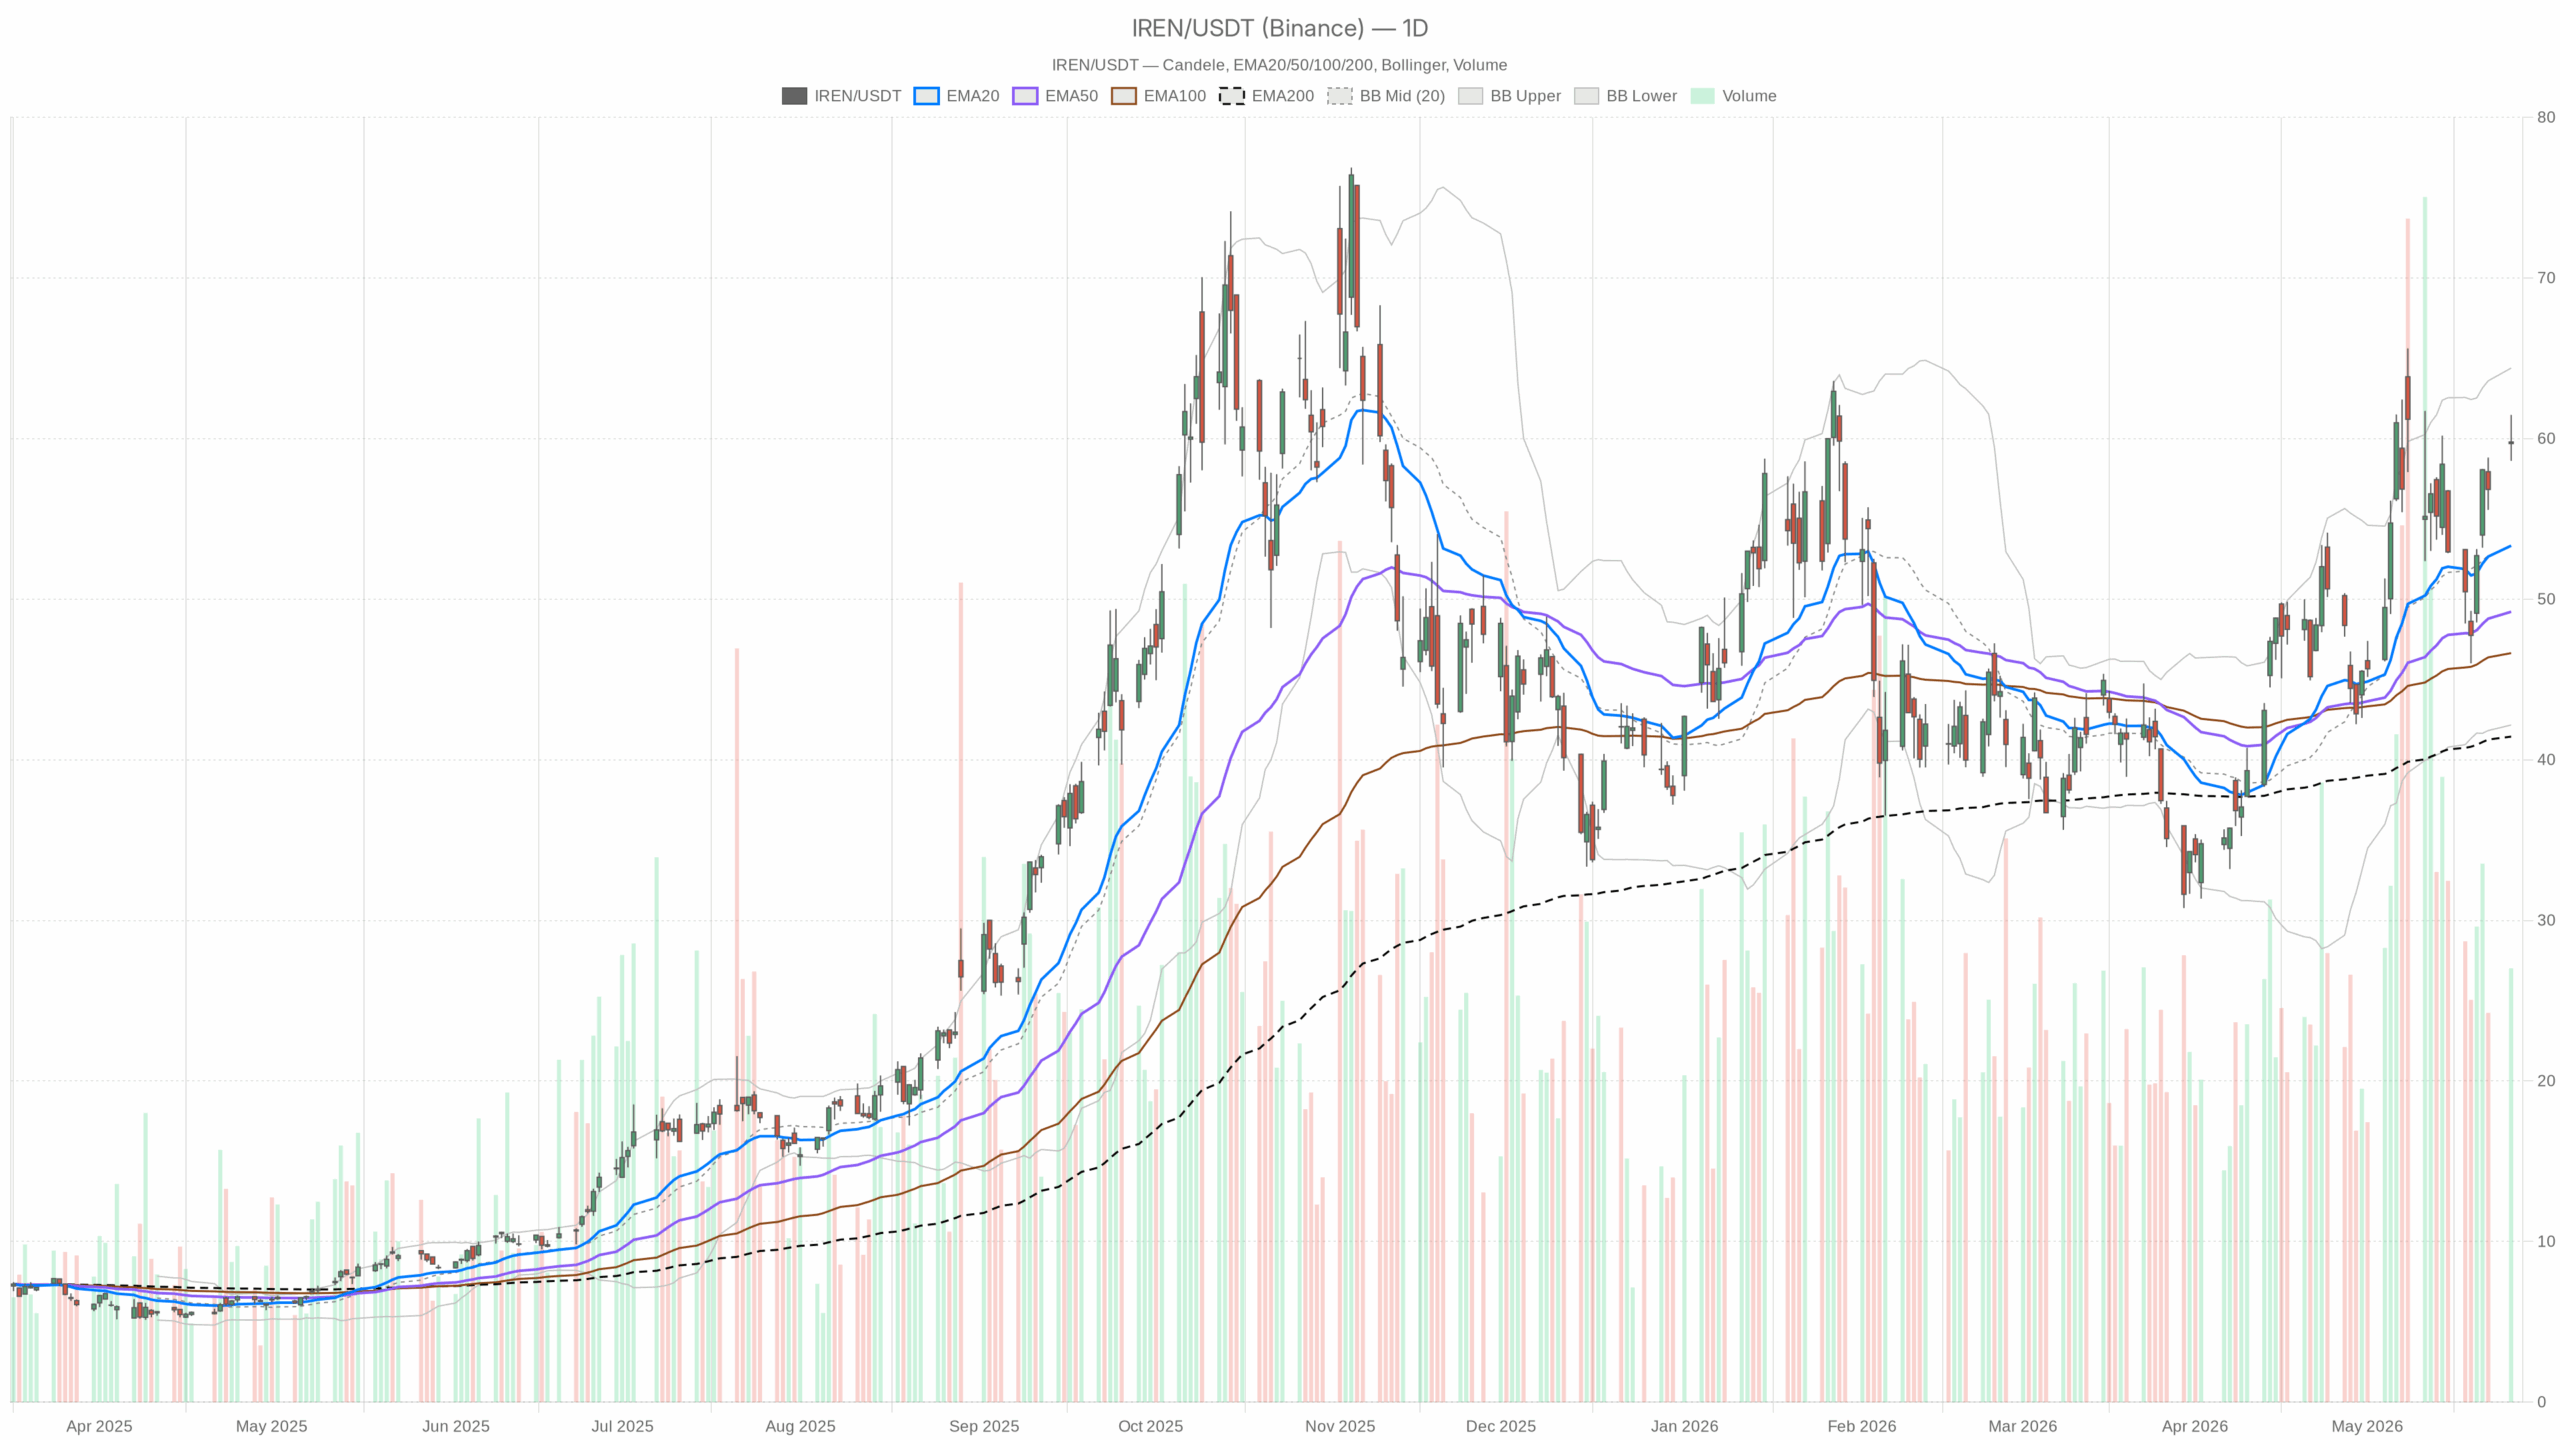 IREN — daily chart with candlesticks, EMA20/EMA50 and volume.
Daily Chart: IREN Stock Uptrend Intact Beneath 60–61
Trend and Momentum
On the daily chart, the close at 59.78 sits well above key EMAs. The EMA20 is 53.33, the EMA50 is 49.21, and the EMA200 is 41.44. That keeps the primary trend firmly bullish. The daily RSI14 is 59.53. Momentum is constructive without overbought stretch. The daily MACD is 2.72 vs a 2.73 signal, leaving the histogram near zero. That marks a pause in upside acceleration rather than a reversal.
Volatility and Key Levels
Bollinger Bands center on 53.28 with an upper band at 64.39 and a lower band at 42.16. Price is below the upper band, leaving room if buying resumes. The ATR14 is 5.68, reflecting elevated daily ranges. The daily pivot sits at 59.95 with R1 61.30 and S1 58.44. Price is just under the pivot, so the 59.95–61.30 zone is tactically important for IREN Stock. Daily volume of 40.5 million underscores strong participation.
Hourly Chart Backs the IREN Stock Advance
Meanwhile, the 1H timeframe corroborates the bullish bias. Price holds above the rising EMA20 57.69, EMA50 55.67, and EMA200 51.53. That keeps intraday trend support intact. The hourly RSI14 stands at 63.64, with momentum firm but not extreme. The hourly MACD is positive with a 0.06 histogram, indicating steady upside pressure.
Bollinger Bands show a midline at 58.03 and an upper band at 60.86. Price is tracking the upper half of the band, consistent with a grind higher. Hourly ATR14 is 1.63; swings are active but manageable. The 1H pivot is 59.89, with R1 60.25 and S1 59.43. Price is hovering just below the pivot and under R1, highlighting a nearby resistance shelf to clear for IREN Stock.
15-Minute Setup: Coil Under Round Numbers
At the same time, the 15‑minute chart frames the execution zone. Price is above the EMA20 59.46 and the EMA50 58.50, so short‑term trend support is holding. The 15‑minute RSI14 prints 54.82, keeping momentum neutral to positive.
The 15‑minute MACD shows a small negative histogram at -0.08. That flags a brief loss of pace during consolidation. Bollinger Bands center on 59.75, with price hugging the midline. The 15‑minute pivot is 59.87 with R1 60.10 and S1 59.57. Price sits under the pivot, so a micro break over 59.87–60.10 would mark fresh intent.
Flows and Headlines: Supportive but Mixed
Notably, flows and headlines lean supportive. Paul Tudor Jones increased his IREN stake by 57%, a high‑profile vote of confidence in the company’s AI infrastructure exposure. IREN’s addition to the Russell 3000 Index also adds potential passive demand. That can bolster liquidity around rebalancing.
In contrast, a comparison piece highlighted Cipher Digital and its contracted revenue base as an edge. That frames competitive pressure within AI data centers. In addition, the CEO offered a reality check to the AI boom. That tempers sentiment and can cap exuberance. The Awaken deal extends IREN’s brand push. That may aid positioning, though financial impact is not visible in these technicals. For IREN Stock, the net read is supportive but measured.
Trading Scenarios for IREN Stock
Bullish Scenario
Bullish scenario for the IREN stock price: a sustained reclaim of the daily pivot at 59.95 would strengthen upside control. An hourly close above 60.25 would add confirmation. That setup targets daily R1 61.30. A daily close through 61.30 would then open room toward the upper Bollinger Band at 64.39. This sequence aligns with constructive RSI and the absence of a daily MACD breakdown.
Bearish Scenario
In contrast, the bearish scenario emerges if price fails to clear 60.25–61.30. A subsequent loss of 59.43 on the hour and 58.44 on the day would confirm pressure. Focus would then shift to whether buyers defend the daily EMA20 53.33. A decisive close below the EMA20 would invalidate the daily uptrend and hand control back to sellers. A rollover in daily MACD from flat to decisively negative would add confirmation.
Overall, positioning in IREN Stock remains long‑tilted but sensitive to headlines and index flows. Daily ATR is elevated, so breakouts can travel quickly in either direction. Until 61.30 is cleared or 58.44 is lost, expect a two‑sided tape with reaction levels prioritized over drift. For IREN Stock, reaction to 60–61 remains the gatekeeper.


You May Also Like

Biographer predicts a historic end to the Trump administration

Crypto Hack: Drift Protocol Drained Over $200M in Private Key Breach

DRIFT Hacked: 280M$ Loss and Price Collapse



