

Bitcoin Price Teeters Near The Edge As Bears Eye Another Breakdown
Bitcoin price started a fresh decline below the $73,800 zone. BTC is consolidating and might continue to move down if it dips below $72,500.
- Bitcoin failed to stay above $74,200 and extended losses.
- The price is trading below $73,800 and the 100 hourly simple moving average.
- There was a break below a rising channel with support at $73,550 on the hourly chart of the BTC/USD pair (data feed from Kraken).
- The pair might extend losses if it stays below the $74,200 and $74,500 levels.
Bitcoin Price Turns Red
Bitcoin price failed to stay above the $75,000 support zone. BTC remained in a bearish zone and extended losses below the $74,500 level. There was a move below the $74,000 level.
The price even dipped below $73,000. A low was formed at $72,470 and the price recently attempted a recovery wave. There was a minor move above the 23.6% Fib retracement level of the downward move from the $77,810 swing high to the $72,470 low.
However, it faced resistance near $74,000. Recently, there was a break below a rising channel with support at $73,550 on the hourly chart of the BTC/USD pair. Bitcoin is now trading below $73,800 and the 100 hourly simple moving average.
If the price remains stable above $72,000, it could attempt a fresh increase. Immediate resistance is near the $73,850 level. The first key resistance is near the $74,000 level. A close above the $74,000 resistance might send the price further higher. In the stated case, the price could rise and test the $74,500 resistance.
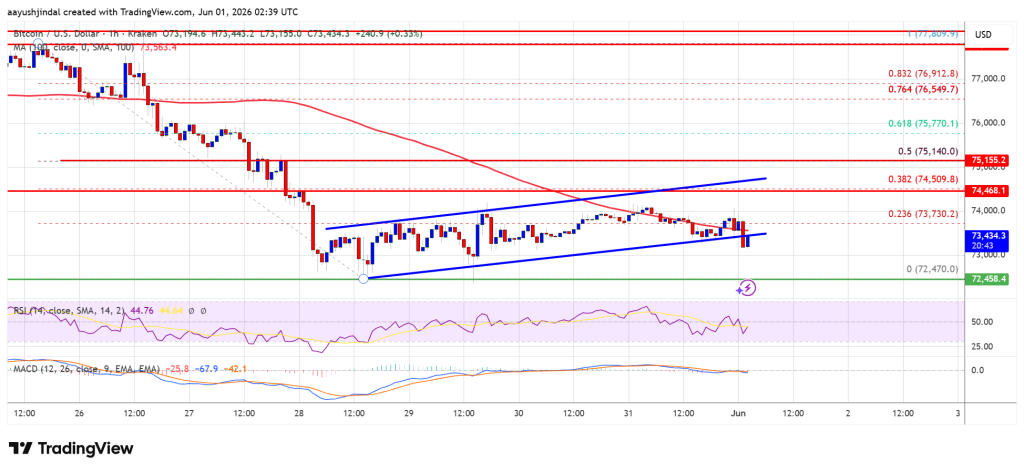
Any more gains might send the price toward the $75,150 level or the 50% Fib retracement level of the downward move from the $77,810 swing high to the $72,470 low. The next barrier for the bulls could be $75,500.
Downside Continuation In BTC?
If Bitcoin fails to rise above the $74,200 resistance zone, it could start another decline. Immediate support is near the $73,000 level.
The first major support is near the $72,500 level. The next support is now near the $72,000 zone. Any more losses might send the price toward the $71,500 support in the near term. The main support now sits at $70,850, below which BTC might struggle to recover in the near term.
Technical indicators:
Hourly MACD – The MACD is now gaining pace in the bearish zone.
Hourly RSI (Relative Strength Index) – The RSI for BTC/USD is now below the 50 level.
Major Support Levels – $72,500, followed by $72,000.
Major Resistance Levels – $74,000 and $74,500.


You May Also Like

The changing face of elder care in Malaysia — Sayed Mohammad Reza Yamani Sayed Umar

Not a loophole: Singapore AI export controls let China tap US AI legally

Bitcoin, Gold, and U.S. Stocks Dive as Trump Pledges to Hit Iran ‘Extremely Hard’


