

John Deere company holds above 200-day EMA as $541 pivot decides next move

John Deere company (DE) is stabilizing in the low $540s above the 200‑day EMA, but the tape remains soft as price lags near-term averages. Mixed timeframes keep risk elevated and argue for tactical execution around the $541 pivot while buyers try to defend the $540 area.
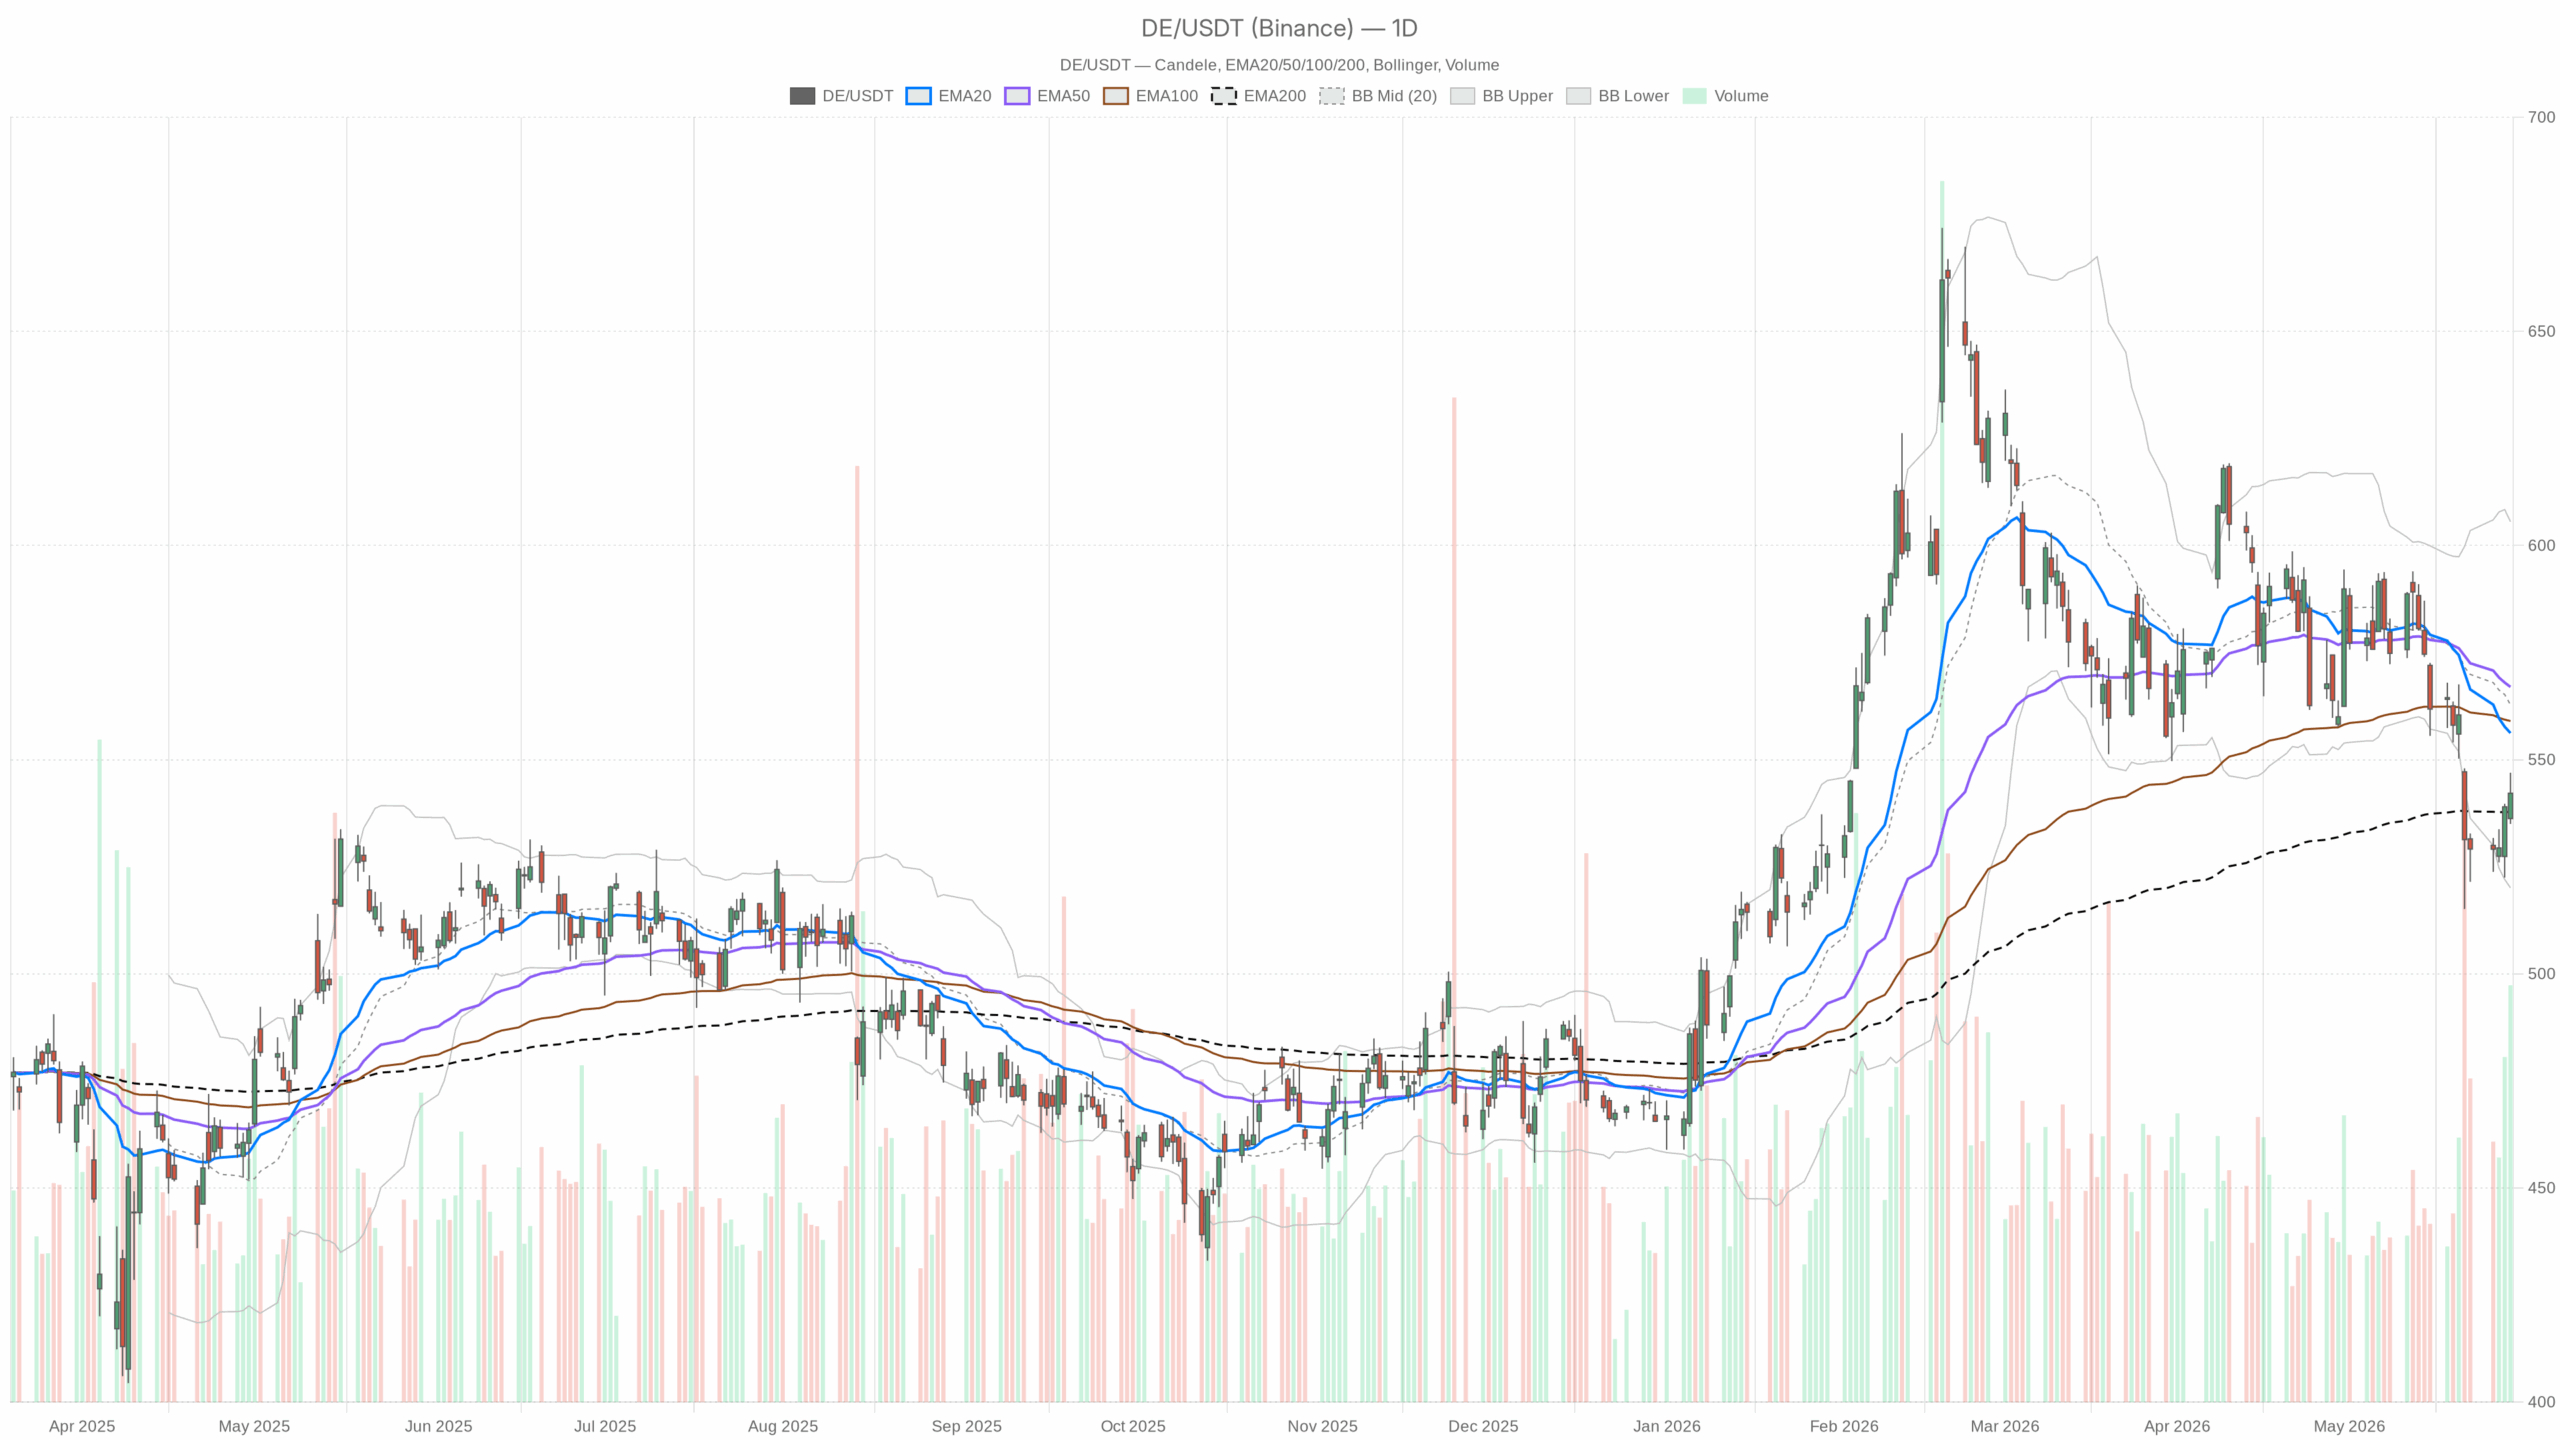 DE — daily chart with candlesticks, EMA20/EMA50 and volume.
Daily Technical Overview for John Deere company (DE)
On the daily chart, DE closed at 542.18 while sitting below the 20‑day EMA at 556.22 and the 50‑day EMA at 567, yet just above the 200‑day EMA at 537.82. That setup signals a short‑term downtrend trying to hold long‑term support. The daily RSI(14) is 40.6.
Momentum is subdued and not yet in accumulation territory. The daily MACD is -12.39 with a -9.33 signal and a -3.05 histogram. Downside pressure persists with no clear bullish crossover.
Daily Bollinger Bands center on 562.84 with the lower band at 520.09. Price is lodged in the lower half of the envelope, which reflects supply overhead and room to probe lower if support fails. Meanwhile, the ATR(14) is 15.16, keeping daily position risk elevated.
Finally, the daily pivot is 541.39 with R1 at 547.77 and S1 at 535.79. Trading around the pivot implies indecision, with nearby levels to test on either side.
Hourly Chart: Attempted Recovery in DE
Meanwhile on the 1‑hour chart, the tone is more constructive. Price at 542.51 is above the hourly 20‑EMA at 538.87 and the 50‑EMA at 541.09, while still far below the 200‑EMA at 560.98. Intraday momentum has turned up, but the bigger cap remains overhead.
The hourly RSI(14) at 59.19 leans bullish. Buyers have the near‑term initiative. In addition, the hourly MACD reads 2.73 with a 1.46 signal and a 1.26 histogram, allowing for upside follow‑through if it holds.
Hourly Bollinger Bands are centered near 536.53. Price riding the upper half indicates a bid returning intraday. The hourly ATR(14) is 3.96, keeping volatility manageable for tactical trades.
The H1 pivot sits at 542.70 with R1 at 544.53 and S1 at 540.68. Price near the pivot sets a tight decision band for the next push.
15‑Minute View: Micro Momentum Fades
In contrast, the 15‑minute view shows some stalling. Price at 542.51 is below the 15‑minute 20‑EMA at 543.74, but still above the 50‑EMA at 540.40 and the 200‑EMA at 541.56. Very short‑term momentum is fading while the micro trend stays supported.
The 15‑minute RSI(14) is 48.02, with balance shifting to neutral. Moreover, the 15‑minute MACD is 1.20 versus a 1.75 signal with a -0.55 histogram, showing momentum cooling into resistance.
Bollinger Bands on M15 are centered at 544.68 with the lower band at 542.81. Price hugging the lower band warns of a minor dip risk. The M15 ATR(14) is 1.53. Micro ranges are tight, so whipsaws around the pivot at 542.52 (R1 544.16; S1 540.87) are likely.
Bias and Trading Stance for John Deere company
Therefore, the primary bias from the daily timeframe is neutral‑to‑bearish while the hourly backdrop attempts a recovery. The mixed setup argues for a fade‑the‑rip stance until the daily chart repairs, but allows room for an intraday squeeze if buyers defend the $540 area.
Bullish Scenario for DE
A sustained push above the H1 R1 at 544.53 and the daily R1 at 547.77 would confirm near‑term control for buyers. That would shift focus toward the 20‑day EMA at 556.22 and the daily Bollinger mid near 562.84. Reclaiming those zones would start to neutralize the soft daily momentum.
A hold above the daily pivot at 541.39 would help maintain that path. In this case, the hourly RSI staying near 60 and MACD remaining positive would support follow‑through.
Short‑term execution cues on M15 include regaining the 20‑EMA at 543.74 and clearing the M15 R1 at 544.16. Those micro wins would show demand stepping up through nearby supply.
Bearish Scenario for DE
On the other hand, the bearish scenario gains traction if DE loses the daily pivot at 541.39 and breaks the 200‑day EMA cluster near 537.82, with the daily S1 at 535.79 the next check. That would reopen a path toward the daily lower Bollinger band around 520.09.
A daily RSI pushing toward the mid‑30s and a still‑negative MACD would align with that slide. For invalidation of the bullish case, a decisive daily break back below the 200‑day EMA and a close under 537–536 would do it. That would mark failed repair and put control back with sellers.
News and Catalysts: Light Flow for John Deere company
Notably, news flow around John Deere company is light, limited to a supplier sustainability award involving a partner. There is no fresh company‑specific catalyst in these figures, so levels and momentum are setting the tone.
Strategy Takeaways: Key Levels and Risk
Overall, positioning here favors patience with a tactical bias. Respect the $541 pivot zone and the 537–536 200‑day support, while acknowledging hourly upside attempts. With a daily ATR near 15.16, expect wider swings, and use intraday pivots to manage risk as the market decides whether stabilization turns into repair or fades back toward the lower band.


You May Also Like

The AI Agent Shift: From Chat-bots to Independent Systems

Four “Financial Journalists” In Forbes Are Fake AI. This Is Why Decentralized Journalism Matters Now.

The Corporate Meltdown That Could Crush Bitcoin⚠️


