

Bitcoin price today drifts near $73k as ETF outflows extend streak

With risk appetite fading, Bitcoin price today sits near 72,972 as ETF outflows and a defensive tape weigh on bids, while price tests the lower Bollinger Band.
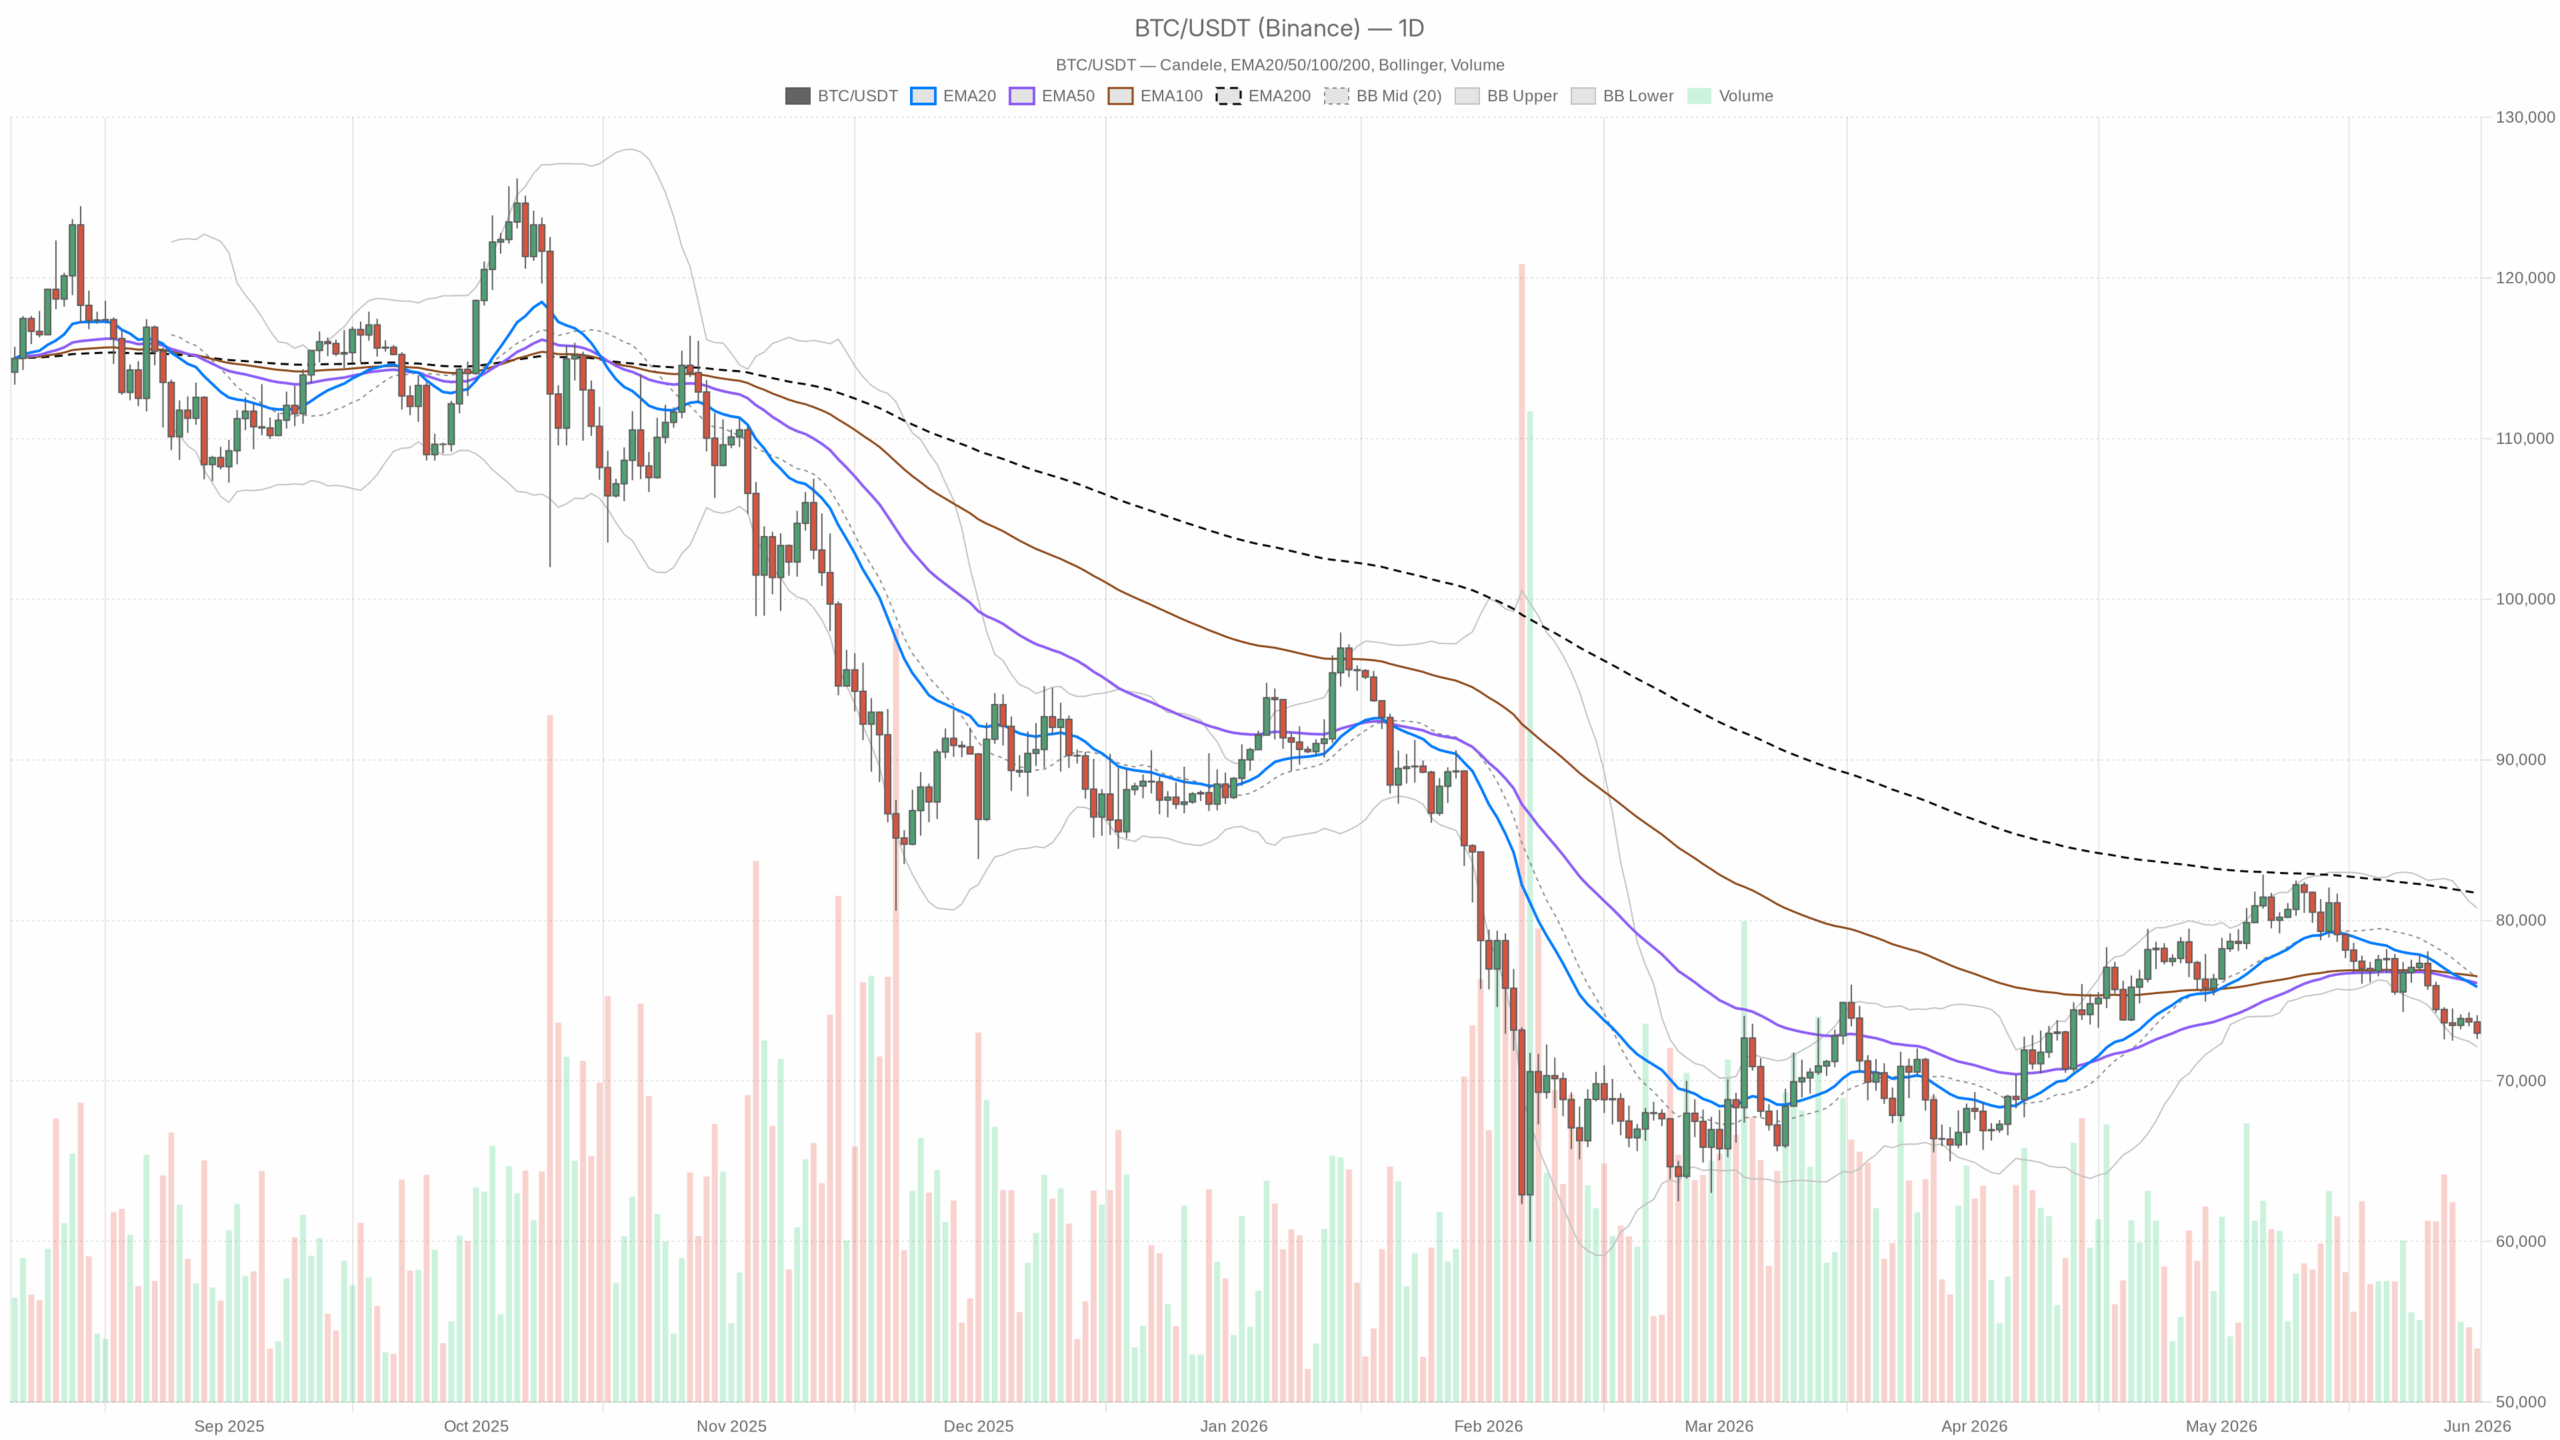 BTC/USDT — daily chart with candlesticks, EMA20/EMA50 and volume.
Market structure first: trend vs. mean reversion
At present, Bitcoin (BTC) trades around 72,972, sits under key daily averages, and leans on the lower half of its ranges. The dominant force is distribution: multi-day ETF outflows and a risk-off tape push price into trend-following, where sellers fade rallies rather than chase breakouts. However, fear is back (index at 29), liquidity remains decent, and the market is testing demand near the lower Bollinger Band.
This moment matters because BTC is pinned between a soft daily pivot at 73,225 and the daily lower band at 72,117. Hold this shelf and a mean-reversion bounce into the 73.5k–74.7k supply zone is likely. Conversely, lose it and the downtrend extends toward the 71k handle on expansion. That said, the burden of proof remains on the bulls until the daily trend is reclaimed.
Daily bias is bearish: price sits below the 20/50/200-day EMAs with negative momentum. On the hourly, the pattern is consistent: lower highs, rallies capped by the 20/50-hour EMAs, and distribution in the lower half of the Bollinger envelope. However, the only bright spot is micro. On 15-minute, momentum is trying to base with a tiny MACD uptick, typical when markets probe a support shelf. That is execution context for countertrend scalps, not yet a shift in regime.
Moreover, risk appetite remains defensive. Bitcoin dominance sits near 57.2%, consistent with capital hiding in BTC relative to alts during corrective phases. Newsflow has not helped: the longest United States spot ETF outflow streak and geopolitics have kept dips from attracting sticky bids. Volatility has been subdued recently, but ATRs show there is still enough juice to clear nearby levels on either side. Meanwhile, Bitcoin price today underscores that defensive stance.
Multi-timeframe read
Daily (macro bias): Bearish. Price is under the 20/50/200-day EMAs with RSI stuck in the 30s and MACD stretching lower. That said, as of 1 June 2026, we are hovering just above the daily lower Bollinger Band — classic for a reflex bounce, but also where band walks can accelerate if support gives.
1-Hour (tactical confirmation): Bearish. All key intraday EMAs sit overhead (73.45k/73.66k/74.64k). RSI is weak, MACD negative. For now, until BTC can reclaim the 73.5k–73.7k pocket, bounces are suspect.
15-Minute (execution context): Cautious basing attempt. However, price is still below its short EMAs, but MACD histogram just ticked positive. If buyers can hold above ~72.9k and push through 73.1k/73.36k, a squeeze into the hourly EMAs becomes feasible.
Indicator check (with quick human take)
Daily RSI (14): 34.64 — Weak momentum; not washed out, so sellers still have room.
Meanwhile, Hourly RSI (14): 37.32 — Intraday pressure remains to the downside.
Still, 15m RSI (14): 40.23 — Early stabilizing but below neutral; bounce attempts can fade.
Daily MACD: line -1197.62, signal -694.68, hist -502.94 — Consequently, downside momentum is building; no bullish cross forming.
Moreover, Hourly MACD: line -213.12, signal -126.91, hist -86.21 — Bears still control the tape intraday.
However, 15m MACD: line -190.13, signal -192.47, hist 2.34 — Tiny positive turn; a nibble for scalpers, not a trend change.
Daily EMAs: 20D 75,848; 50D 76,093; 200D 81,697 — Price sits below all three; trend is down and rallies face supply.
Hourly EMAs: 20H 73,453; 50H 73,658; 200H 74,637 — Layered resistance above; reclaiming these flips control.
15m EMAs: 20 73,096; 50 73,363; 200 73,655 — Short-term pressure; clears set up a squeeze into hourly levels.
Daily Bollinger Bands: mid 76,440; low 72,117 — However, price is near the lower band; bounce risk is real, but band walks can extend the slide.
Hourly Bollinger Bands: mid 73,518; low 72,865 — Trading in the lower half; sellers fading pops.
15m Bollinger Bands: mid 73,118; low 72,601 — Micro ranges are tight; good for scalps, not for positioning.
Daily ATR (14): 1,699 — Therefore, the ~2.3% average daily range can break nearby supports or resistances within a session.
Hourly ATR (14): 399 — Intraday swings are ~0.5%; be precise with entries.
15m ATR (14): 171 — Tight scalp ranges; expect quick mean reversion unless a catalyst hits.
Daily pivots: PP 73,224; R1 73,839; S1 72,357 — Currently, price sits just below PP; a slip through S1 invites another leg lower.
Meanwhile, Hourly pivots: PP 72,964; R1 73,026; S1 72,910 — Price is chopping around PP; momentum will decide the break.
Additionally, 15m pivots: PP 72,969; R1 72,992; S1 72,949 — Micro ladder is tight; execution-level references only.
Scenarios
Bullish path: Hold 72.9k–72.36k (hourly BB low and daily S1), then push through 73.10k (15m 20EMA) and 73.36k (15m 50EMA). A sustained hourly close above 73.45k–73.66k (20/50H EMAs) opens a squeeze to 74.6k (200H EMA). If momentum persists, 75.8k (20D EMA) is the next battleground, with 76.4k (daily mid-band) the stretch target. Invalidation: an hourly break and hold below 72.36k or a daily close under 72.12k (daily lower band) turns this into a failed bounce and hands control back to trend sellers.
Bearish path: Fail to reclaim the 73.2k daily pivot and roll back below 72.86k (hourly band low), then 72.36k (daily S1). With daily ATR ~1.7k, a normal extension projects into the 71.2k–71.5k zone, with the 71k handle a magnet if flows remain negative. Invalidation: reclaim and hold above 73.7k on the hour, then 74.6k (200H EMA). A daily close back over 75.8k would neutralize the bearish bias.
Positioning, risk, and uncertainty
Given the daily trend is down and intraday pressure is intact, the default playbook is to sell strength into the 73.5k–74.7k band until proven otherwise. Countertrend longs only make sense near the 72.9k–72.1k shelf with tight risk and quick profit-taking, using the 15m basing attempts for timing. Furthermore, headline risk from ETF flows and geopolitics can quickly widen ranges; size accordingly, respect ATR, and let the hourly reclaim of key EMAs be your signal that the market is shifting from trend to mean reversion rather than guessing it.
Overall, bears have the initiative while BTC hovers near the lower band, with pivots and hourly EMAs likely to define the next impulse. A hold above lower supports favors a snapback into supply, while a break beneath them opens room toward 71k until flows and momentum improve.


You May Also Like

The Corporate Meltdown That Could Crush Bitcoin⚠️

BOE Official Says Stablecoin Demand Could Lose Momentum

Starbucks to award bonuses to baristas, expand tipping


