-
The Bitcoin price has come under significant selling pressure that has dragged the levels below $71,500, with a rise in trading activity
-
Besides, Bitcoin’s weakening momentum, negative ETF flows, and rising realised losses suggest bearish pressure remains dominant in the near term
Bitcoin (BTC) price has come under renewed selling pressure after failing to sustain its recovery above the $75,000 region. The latest decline has pushed the price below a key support zone, while multiple on-chain and market indicators are flashing warning signs. The price is currently trading around $71,564 with a drop of 2.73%, while the trading volume has increased by more than 145%.
As BTC approaches a crucial support area near $69,000, traders are closely watching whether buyers can step in before a deeper pullback unfolds.
Top Reasons Why Bitcoin’s Correction May Continue
Bitcoin has slipped below a key support zone, while several on-chain and market indicators are beginning to weaken. The latest data suggests buying momentum is fading, raising the possibility that the ongoing correction could extend further before a meaningful recovery takes shape. The Glassnode data below highlights that the BTC price structure has broken and here’s why momentum favours the downside near-term.
- Realized Profit/Loss Ratio has dropped to -0.87, indicating investors are realizing more losses than profits. This typically reflects weakening confidence and increased selling pressure during correction phases.
- Price Momentum has fallen near the lower band, signaling that bullish strength has faded significantly. The indicator suggests sellers currently have the upper hand in the short term.
- Funding Rate remains positive despite the decline, showing traders continue to maintain bullish positions. However, this optimism could increase liquidation risks if prices continue to move lower.
- Weekly ETF Netflows have turned negative at around -$1.27 billion, pointing to weakening institutional demand. Sustained outflows could further reduce buying pressure in the market.
Collectively, these indicators paint a cautious picture for Bitcoin. Weakening momentum, negative ETF flows, and rising realized losses suggest the correction may not be over yet, while persistent bullish positioning in derivatives markets leaves BTC vulnerable to additional downside volatility.
Bitcoin Price Analysis: Charts Suggest More Weakness Ahead
The technical chart also supports the bearish case. Bitcoin has broken below the key support zone around $73,800-$75,800, turning the region into immediate resistance. The price is now approaching the next major support near $69,000, which served as an important pivot level during previous consolidations.
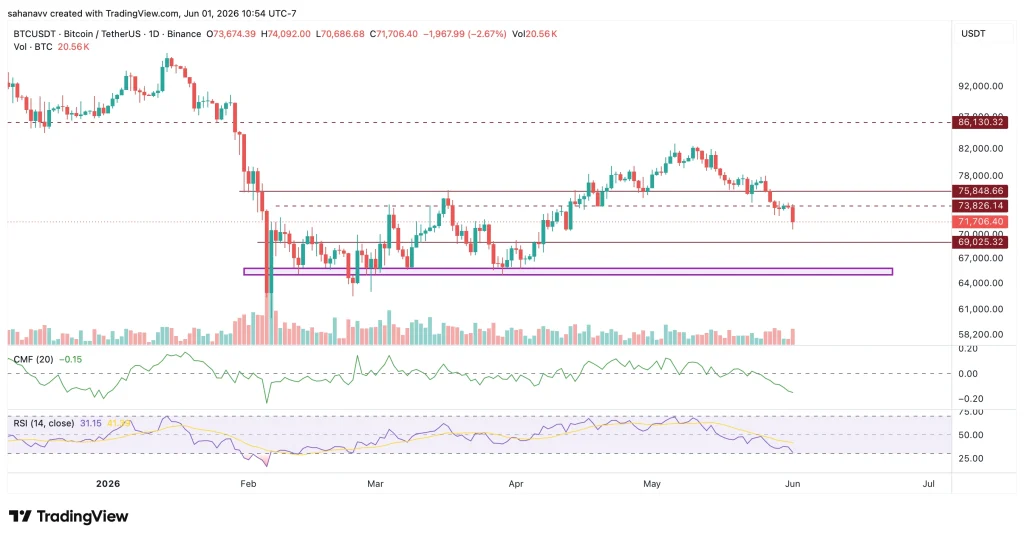
The RSI has dropped near the oversold region around 31, reflecting strong bearish momentum, while the CMF remains below zero, highlighting continued capital outflows from the market. Although an oversold RSI can occasionally trigger short-term relief rallies, the broader structure remains weak unless BTC reclaims the lost resistance zone.
A breakdown below $69,000 could expose Bitcoin to the major demand area around $65,000, which represents the next significant support level on the chart. To prevent an extended bearish trend, the BTC price is required to defend the local support at $70,000 and initiate a strong relief rally to $75,000.
Conclusion: What’s Next for Bitcoin Price?
The combination of a negative Realised Profit/Loss Ratio, weakening momentum, persistent ETF outflows, and bearish technical structure suggests Bitcoin’s correction may not be over yet. While positive funding rates indicate traders are still expecting a rebound, the broader data continues to favor caution. As long as BTC remains below the $73,800-$75,800 resistance zone, the risk of a move toward $69,000 remains elevated. If that support fails to hold, the correction could extend toward the $65,000 demand zone before a stronger recovery attempt emerges.