

Shiba Inu Price Battles Severe Market Fear as 24-Hour Volume Spikes Nearly 20%

The cryptocurrency market is locked in a state of severe risk aversion, and few assets feel this pressure more acutely than meme coins. With the Fear & Greed Index at an extreme 11, the Shiba Inu price faces a difficult defensive battle as Bitcoin dominance nears 56%, draining liquidity away from speculative altcoins.
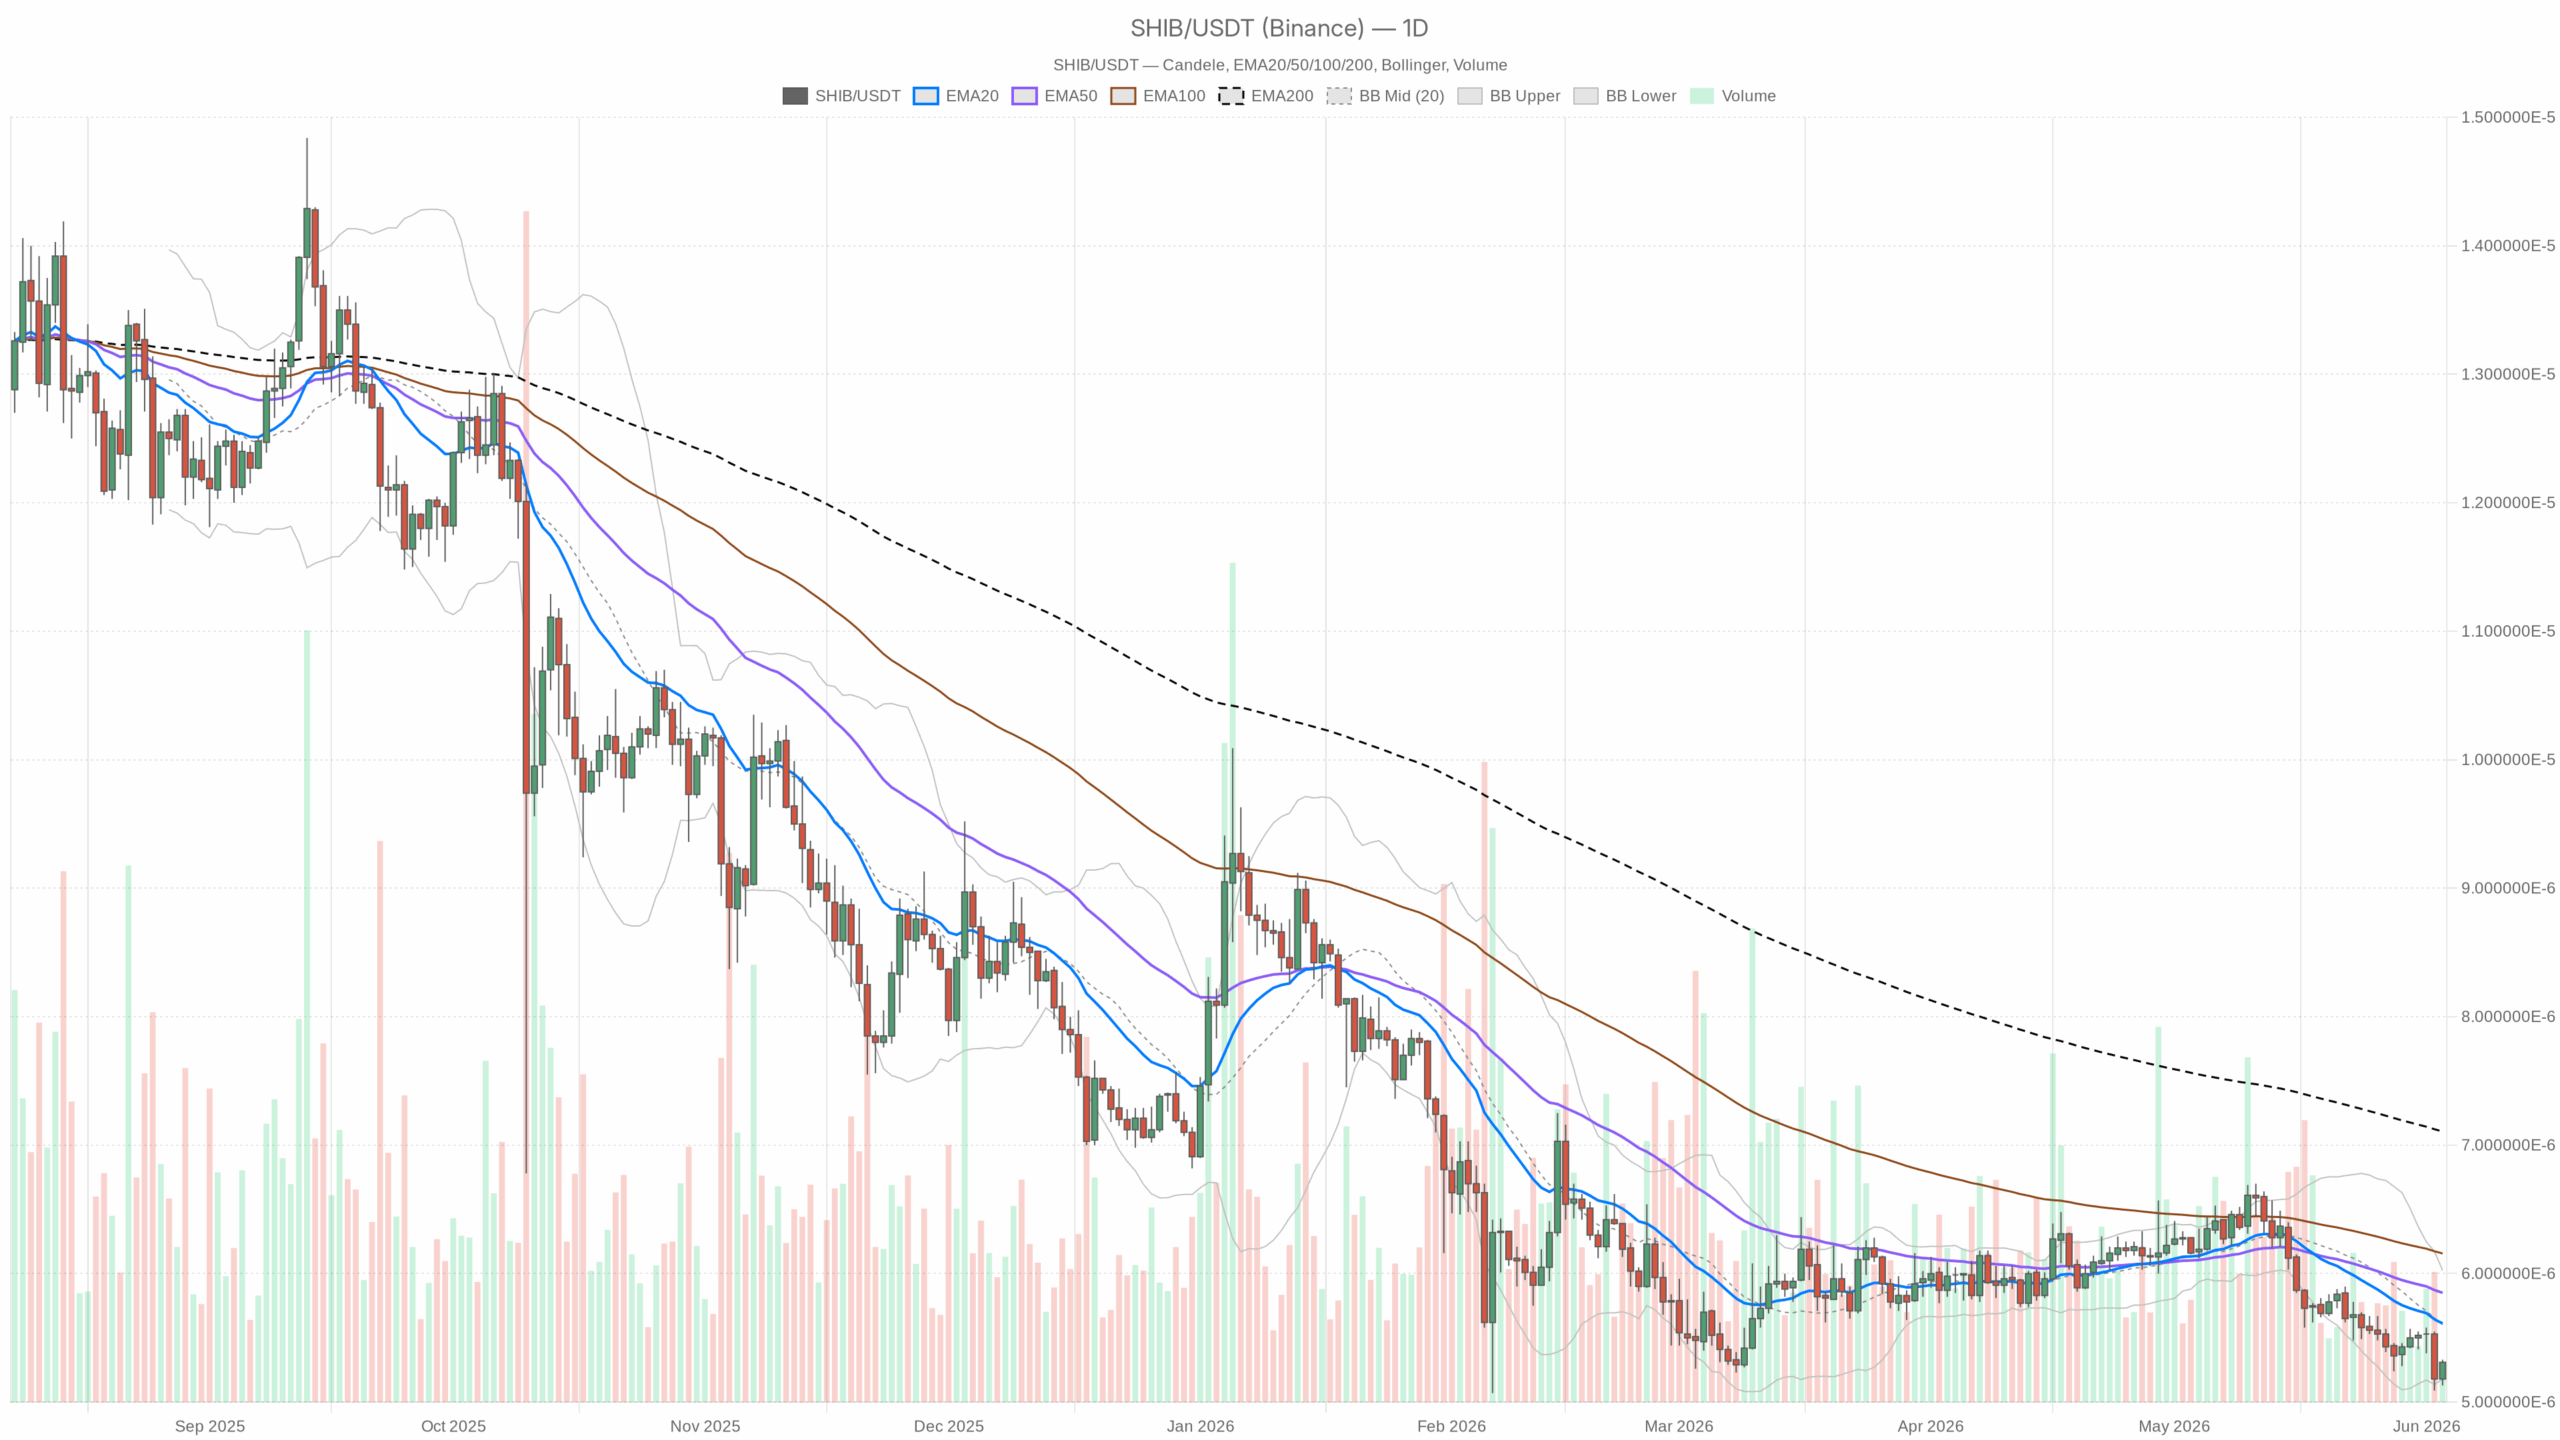 SHIB/USDT — daily chart with candlesticks, EMA20/EMA50 and volume.
Multi-Timeframe Tension Analysis
The daily chart reveals a clear macroeconomic roadblock, with the market operating under a heavy bearish regime. This macro environment is defined by aggressive distribution: a 24-hour volume spike of nearly 20% alongside falling market capitalization confirms an active, high-volume sell-off. The daily RSI is languishing at 35.54, indicating sellers remain firmly in control. There is no structural evidence of a macro bottom yet; instead, we are witnessing the classic grinding price action of a mark-down phase.
However, zooming into the hourly chart, the relentless downward pressure has temporarily paused, shifting into neutral consolidation. The hourly RSI sits at 49.81, showing a perfect equilibrium between buyers and sellers. This neutral regime represents a temporary battleground where the immediate sell-off has lost momentum, allowing the market to build a short-term range.
Meanwhile, the 15-minute execution timeframe confirms this temporary reprieve. Here, the RSI has ticked up to 59.07, leaning slightly bullish. This divergence between the daily downtrend and lower-timeframe momentum indicates aggressive intraday buyers are stepping in to play the mean-reversion game. Short-term scalpers are putting up resistance, trying to squeeze late shorts and push the Shiba Inu price toward the upper boundary of its hourly range.
The Bearish Case: Rejection and Continuation
Given the prevailing macro conditions, the path of least resistance remains to the downside. The minor intraday strength on the 15-minute chart will likely fail to translate into sustained hourly demand. As the price drifts toward local overhead resistance, the lack of spot buying volume will allow bears to easily reassert dominance, pushing the asset back to test the bottom of its consolidation range.
Moreover, a breakdown below the local support shelf would trigger a rapid acceleration of the downtrend. Stop-loss orders from recent buyers would get triggered, feeding the downward momentum. This bearish continuation scenario would only be invalidated if the market can establish a daily close above local resistance structures, effectively ending the bearish daily regime.
The Bullish Case: The Mean-Reversion Squeeze
The bullish thesis is entirely tactical and relies on the market being structurally oversold. With the daily RSI deep in bearish territory and the 15-minute timeframe showing steady accumulation, a short-squeeze remains a strong possibility. If local consolidation can hold ground and absorb remaining sell orders, a sudden burst of short-covering could propel the price rapidly higher toward key moving averages.
However, this would not represent a macro trend shift, but rather a sharp, mechanical bounce back toward realistic value zones. For this recovery to gain real traction, it requires a broader market-wide easing of fear and stabilization of capital outflows. The bullish setup will be immediately invalidated if the price drops below the lowest hourly support, proving intraday demand was nothing more than temporary noise.
Positioning and Risk Realities
In a market gripped by extreme fear, volatility remains exceptionally high and liquidity can become highly fragmented. While lower-timeframe structures hint at a potential intraday bounce, the overarching daily trend demands extreme caution. Traders must carefully weigh the temptation of catching a falling knife against a heavy daily trend showing no definitive signs of structural reversal.


You May Also Like

Best Mobile User Retention Tools in 2026

Egrag Crypto to XRP Investors: You’re Either Early Or You’re Exit Liquidity

Fed Governor Calls For Strong Stablecoin Oversight As CLARITY Act’s Final Text Gets Delayed


