

XRP Price: The Support Level Just Broke — Here’s Where It Could Land Next
TLDR
- XRP has broken below its four-month consolidation range, with the price now trading around $1.16–$1.18, down over 6% in 24 hours.
- The key support zone of $1.26–$1.28, which held through March and April, has now failed.
- Multiple moving averages sit above the current price, with the 200-day EMA above $1.60, pointing to continued bearish pressure.
- If the $1.14–$1.18 support band breaks, analysts have flagged targets as low as $0.92 and $0.63 in a deeper correction.
- The RSI has dropped to around 24, technically oversold territory, while most other indicators still lean bearish.
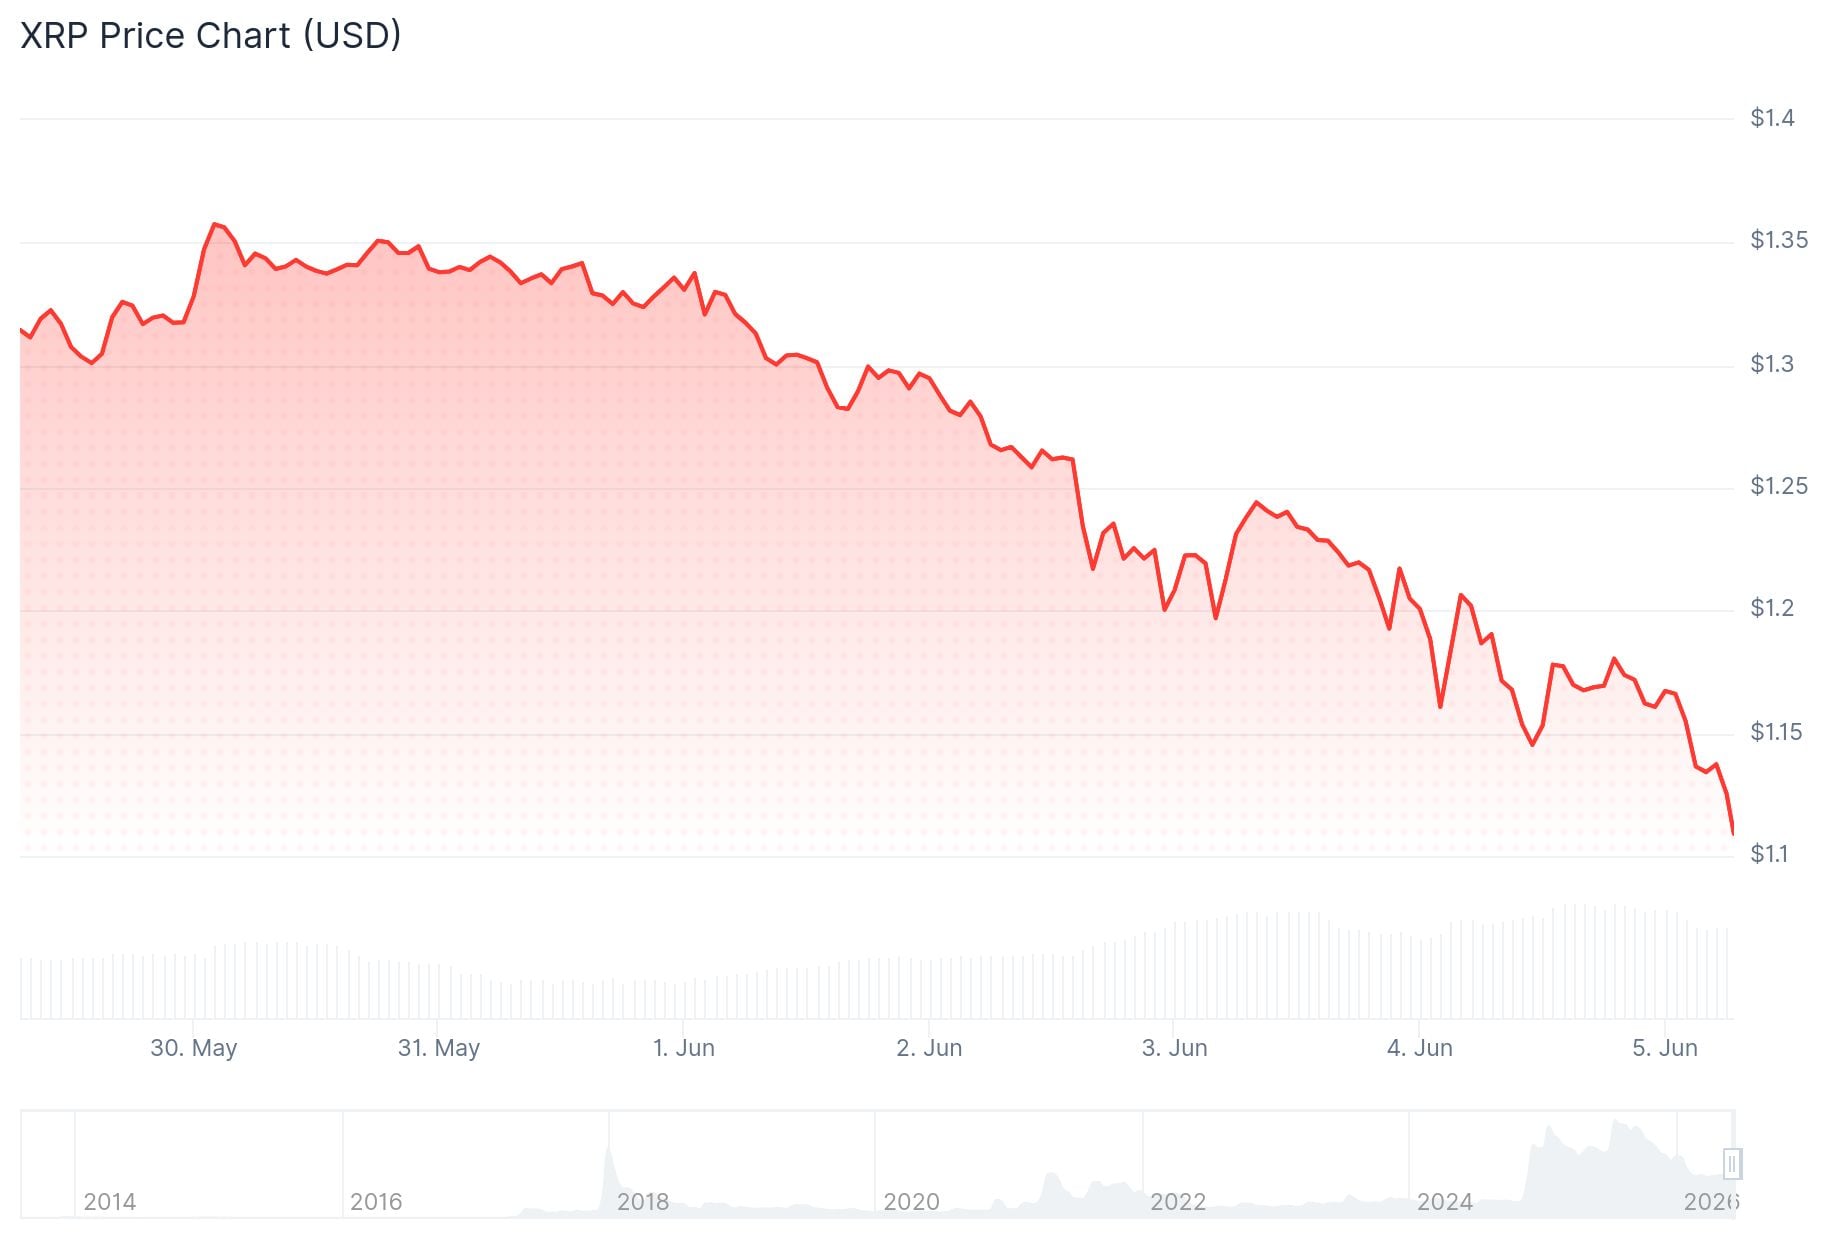
XRP has broken down from a trading range it held for nearly four months. The price is now sitting around $1.16–$1.18, well below the range floor that had held firm through March and April of this year.
 XRP Price
The consolidation range had a ceiling near $1.55 and a floor between $1.26 and $1.28. That floor has now been breached, with XRP falling roughly 6.1% in a single 24-hour period.
Crypto analyst “Guy on the Earth” posted a chart on X showing XRP trading near $1.279 — right on the range low — before it slipped further. His analysis identified $1.10 as the first downside target after losing that support, a level that aligns with the wick low from early February.
It now looks like that scenario is playing out. XRP has already moved below the range floor, and the $1.10 target is within reach.
What the Moving Averages Are Saying
The technical picture is broadly bearish. XRP is currently trading below nearly all major moving averages. The 10-day EMA sits around $1.27, the 50-day EMA is near $1.36, and the 200-day EMA is above $1.60. For XRP to shift sentiment, analysts say it would need to reclaim the $1.30 level with strong volume.
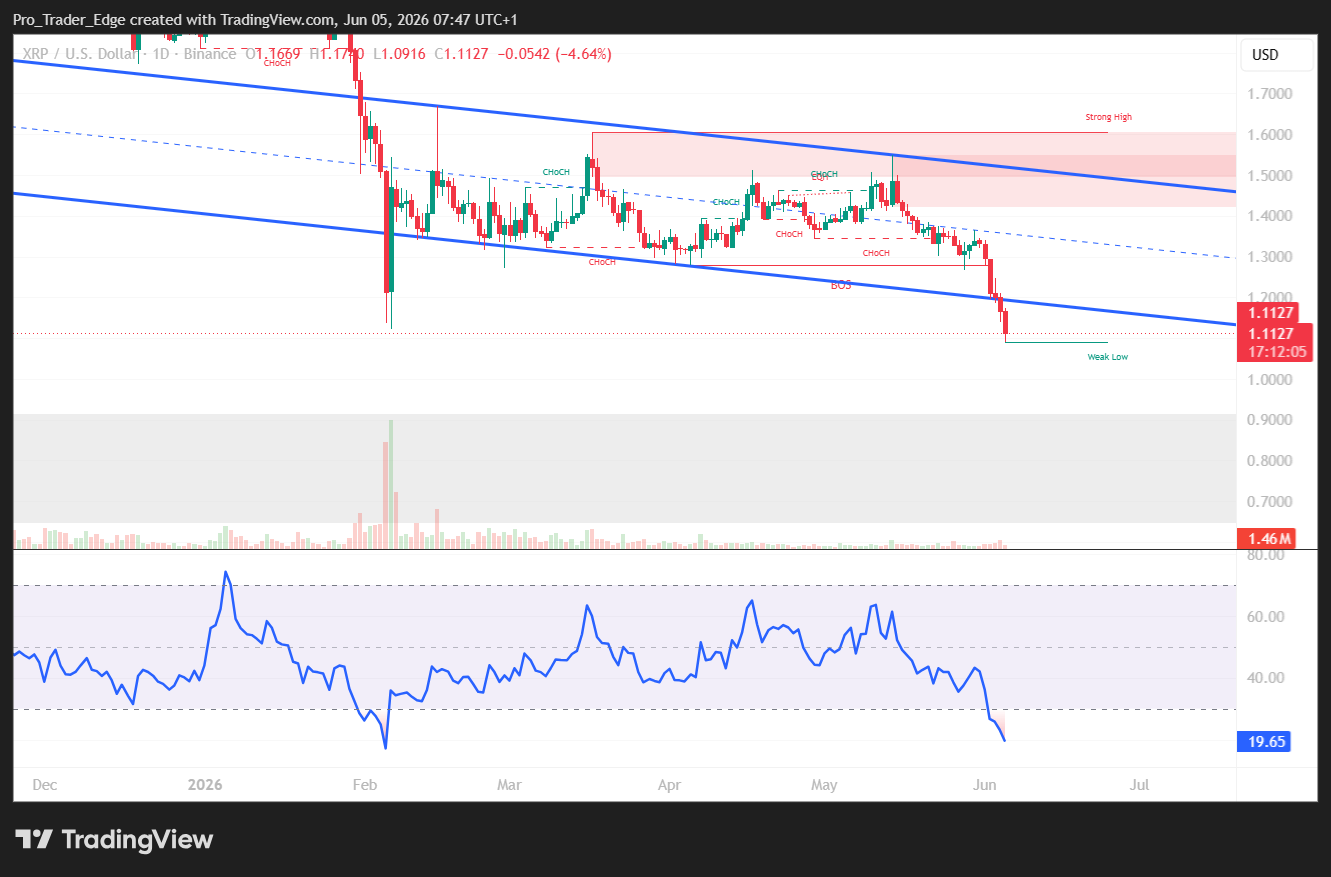 Source: TradingView
The overall TradingView technical summary leans neutral-to-bearish, with moving averages generating the strongest sell signals.
Downside Targets in Focus
Analyst Crypto Patel, posting independently on X, called the $1.10–$1.30 range a current accumulation zone. He said if that breaks, the $0.65–$0.85 range could represent a major buying opportunity.
Analyst “Guy on the Earth” put the most likely bottom zone between $0.75 and $0.95 in a sustained breakdown, with a worst-case level near $0.63 — a level that would wipe out most of XRP’s gains since late 2023.
A separate analysis from trader Blacksea pointed out on X that XRP has printed what appears to be the same falling wedge pattern it formed in 2024, just before a major price move. Blacksea noted the pattern is historically associated with sharp reversals, though the current price action has yet to confirm any breakout.
A Fibonacci retracement level near $0.92 lines up with a widely watched support zone between $0.87 and $0.92. Pivot point analysis also highlights $1.097 as a closer downside level and $0.811 as deeper support.
The RSI-14 has dropped to around 24.26, below the oversold threshold of 30. The Commodity Channel Index sits at around -232. Daily trading volume remains above $3 billion, showing that interest in XRP remains high.
At press time, XRP was trading at approximately $1.17.
The post XRP Price: The Support Level Just Broke — Here’s Where It Could Land Next appeared first on CoinCentral.


You May Also Like

PiggyBank Hedge Drawdown Hits 15% NAV, ZachXBT Flags Risk

26 Best Things to Do in Shenzhen: 2026 Guide, Itineraries & Tips

Pi Network Builds a Web3 Economy Beyond Crypto Exchanges


