Sei price has crashed to an important support level and formed a descending triangle as the number of transactions and active addresses plunged in September. Sei (SEI), a popular layer-1 network, plunged to the key support at $0.2645, its lowest…Sei price has crashed to an important support level and formed a descending triangle as the number of transactions and active addresses plunged in September. Sei (SEI), a popular layer-1 network, plunged to the key support at $0.2645, its lowest…

Sei price nears bearish breakout as transactions plunge 87%

2 min read

Sei price has crashed to an important support level and formed a descending triangle as the number of transactions and active addresses plunged in September.

Summary
  • Sei crypto price has formed a descending triangle pattern.
  • The number of transactions plunged by 87% in the last 30 days.
  • Sei’s unique active wallets fell by 20% in the same period.

Sei (SEI), a popular layer-1 network, plunged to the key support at $0.2645, its lowest level in August and September this year. 

Data compiled by Nansen show that the number of transactions plunged by 87% in the last 30 days to 57 million. This crash makes it one of the worst-performing chains in September.

The data show that active addresses dropped by 24% to 13 million. Also, fees dropped by about 12% to just $16,000.

Sei’s performance in the gaming market, where it dominates, also deteriorated. According to DappRadar, the number of unique active wallets dropped by 20% in the last 30 days to 13.45 million. 

More data shows that its total value locked plunged by 17% in the last 30 days. Most notably, Sei’s stablecoin supply dropped to $140 million, its lowest level since March and much lower than the year-to-date high of $296 million. 

Sei price technical analysis 

Sei price

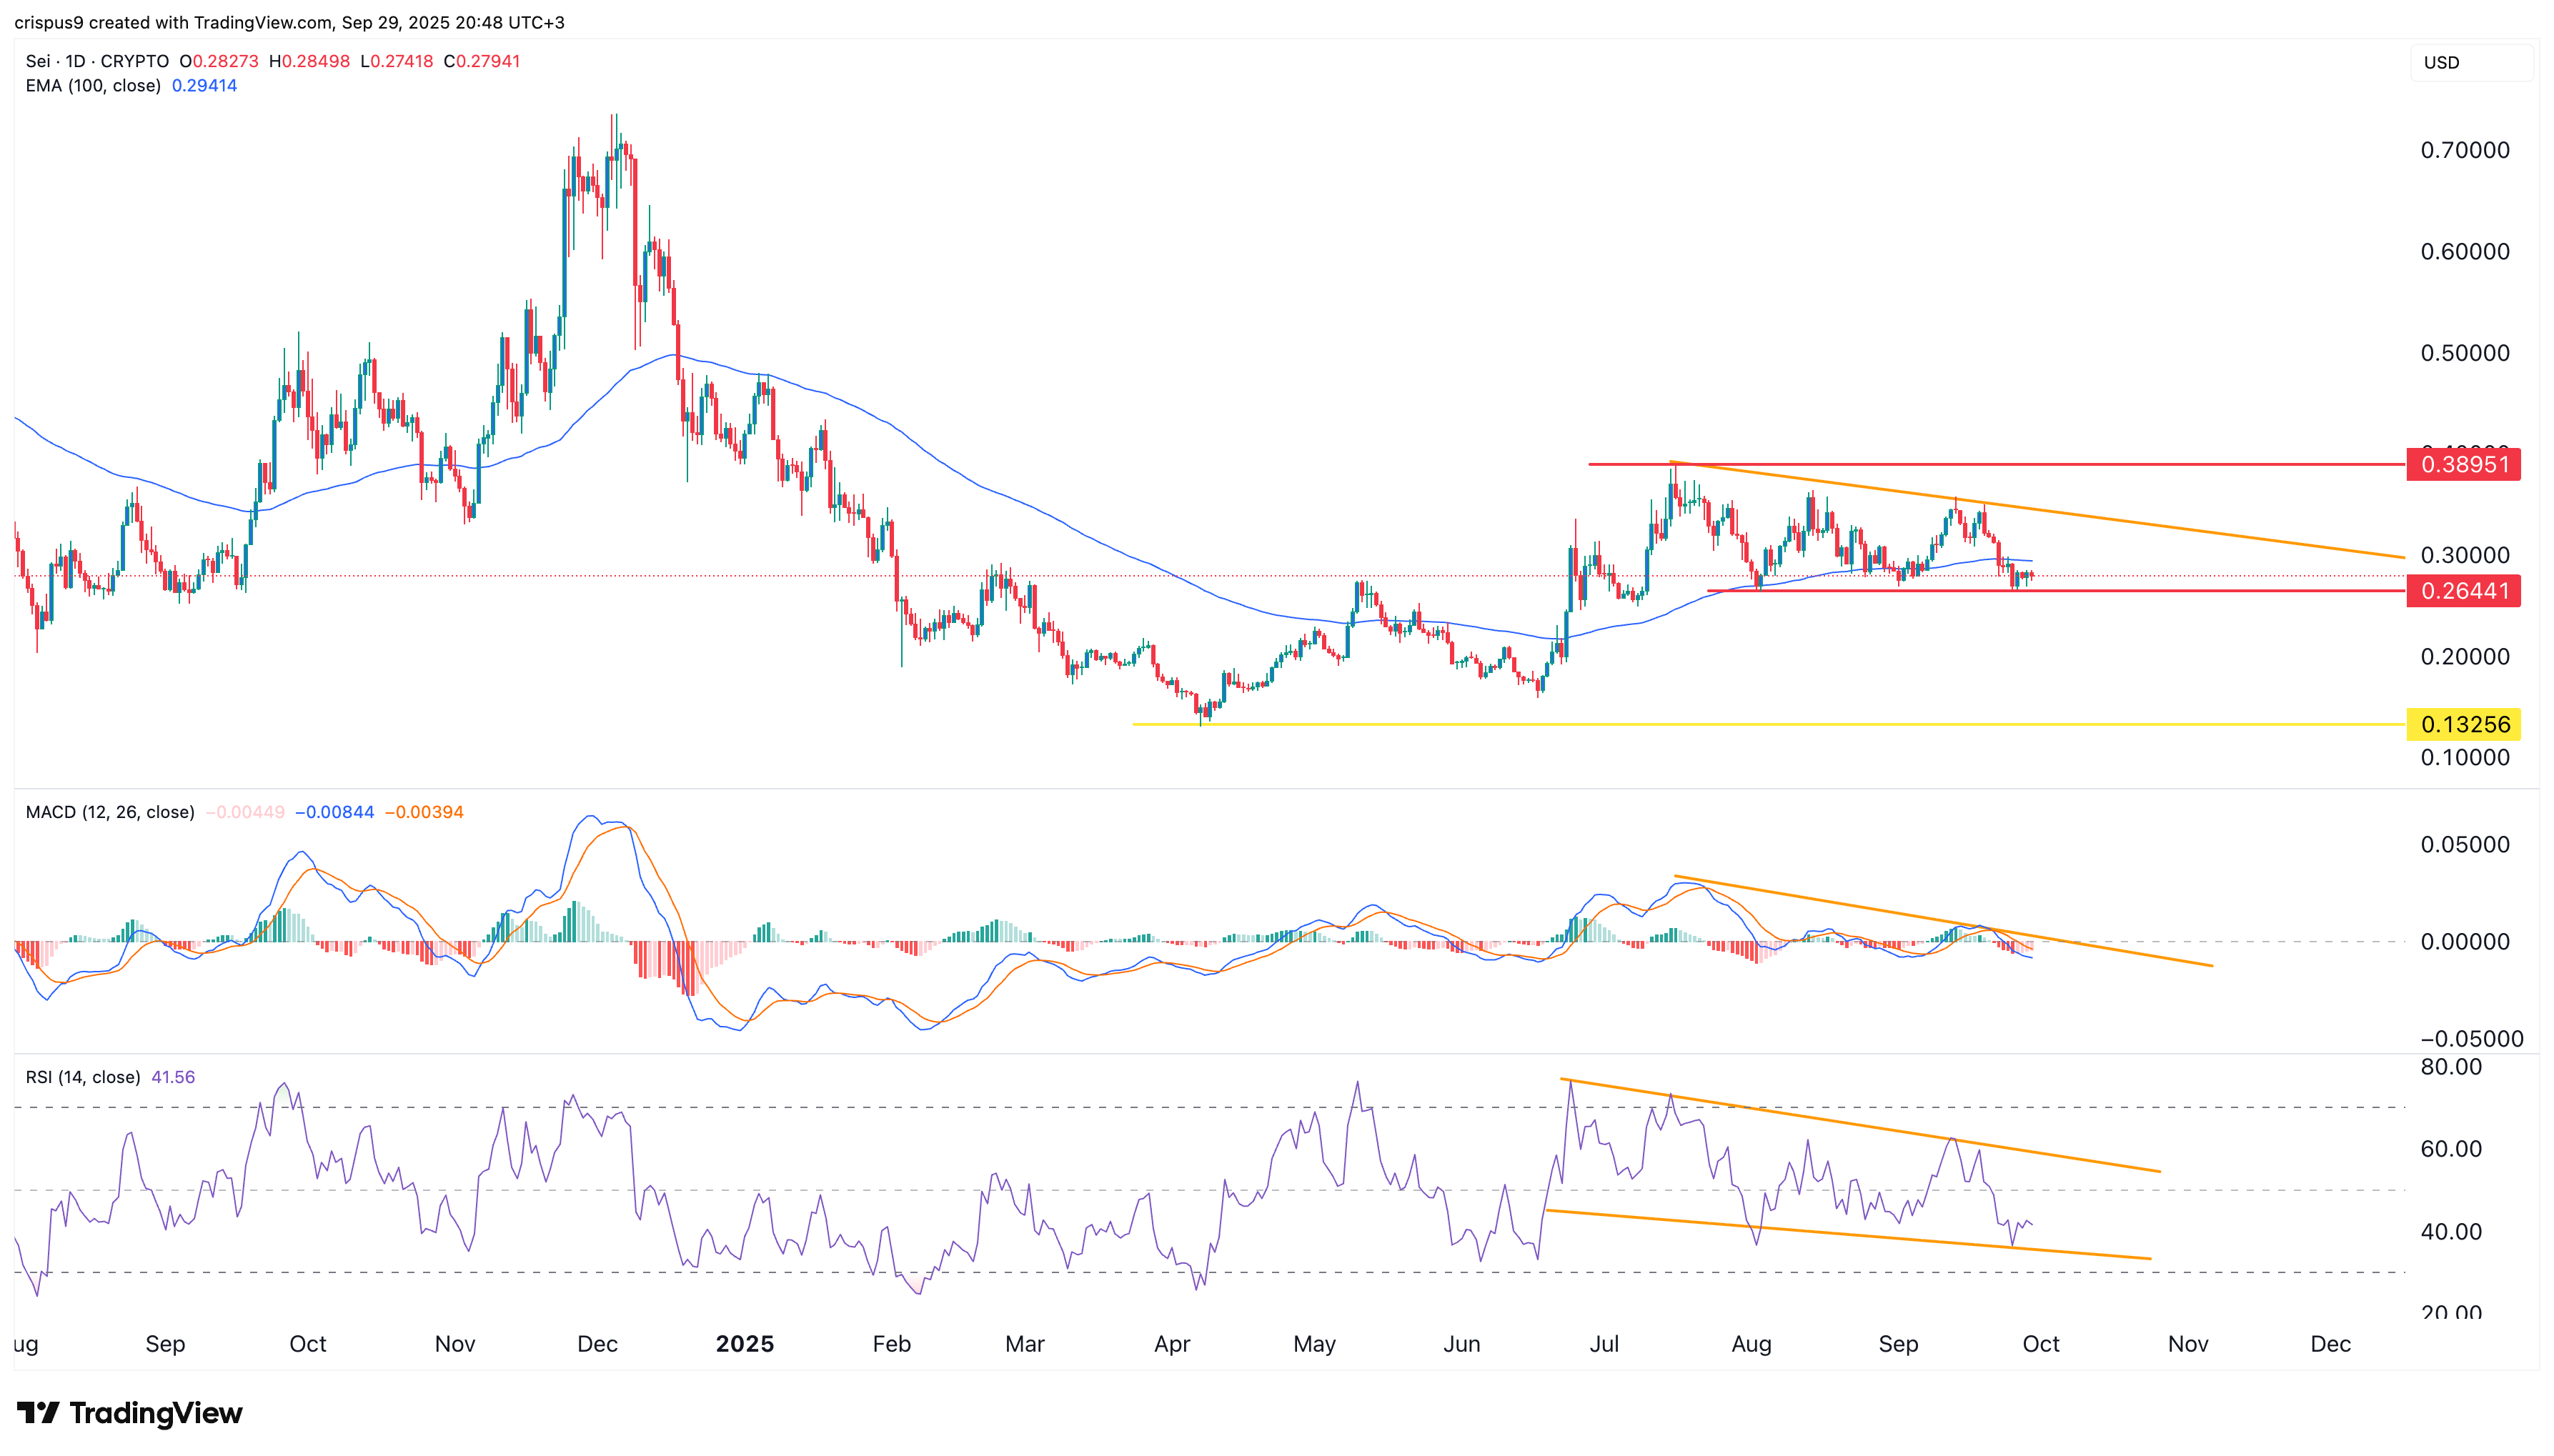
The daily timeframe chart shows that the Sei token price peaked at $0.3895 in July and then dropped to a low of $0.2645. It has crashed below the 50-day exponential moving average.

Sei crypto price has formed a descending triangle pattern whose support is at $0.2645. This is one of the most popular bearish continuation signs.

The Relative Strength Index has been in a downward trend. It has moved close to the oversold level of 70, while the MACD has moved below the neutral level.

Therefore, the token will likely have a strong bearish breakout, with the next point to watch at $0.1325, its lowest level this year. This target is about 50% below the current level. A move above resistance at $0.3500 will invalidate the bearish Sei price forecast.

Market Opportunity
SEI Logo
SEI Price(SEI)
$0.08697
$0.08697$0.08697
-2.11%
USD
SEI (SEI) Live Price Chart
Disclaimer: The articles reposted on this site are sourced from public platforms and are provided for informational purposes only. They do not necessarily reflect the views of MEXC. All rights remain with the original authors. If you believe any content infringes on third-party rights, please contact [email protected] for removal. MEXC makes no guarantees regarding the accuracy, completeness, or timeliness of the content and is not responsible for any actions taken based on the information provided. The content does not constitute financial, legal, or other professional advice, nor should it be considered a recommendation or endorsement by MEXC.

You May Also Like

Egrag Crypto: XRP Could be Around $6 or $7 by Mid-November Based on this Analysis

Egrag Crypto: XRP Could be Around $6 or $7 by Mid-November Based on this Analysis

Egrag Crypto forecasts XRP reaching $6 to $7 by November. Fractal pattern analysis suggests a significant XRP price surge soon. XRP poised for potential growth based on historical price patterns. The cryptocurrency community is abuzz after renowned analyst Egrag Crypto shared an analysis suggesting that XRP could reach $6 to $7 by mid-November. This prediction is based on the study of a fractal pattern observed in XRP’s past price movements, which the analyst believes is likely to repeat itself in the coming months. According to Egrag Crypto, the analysis hinges on fractal patterns, which are used in technical analysis to identify recurring market behavior. Using the past price charts of XRP, the expert has found a certain fractal that looks similar to the existing market structure. The trend indicates that XRP will soon experience a great increase in price, and the asset will probably reach the $6 or $7 range in mid-November. The chart shared by Egrag Crypto points to a rising trend line with several Fibonacci levels pointing to key support and resistance zones. This technical structure, along with the fractal pattern, is the foundation of the price forecast. As XRP continues to follow the predicted trajectory, the analyst sees a strong possibility of it reaching new highs, especially if the fractal behaves as expected. Also Read: Why XRP Price Remains Stagnant Despite Fed Rate Cut #XRP – A Potential Similar Set-Up! I've been analyzing the yellow fractal from a previous setup and trying to fit it into various formations. Based on the fractal formation analysis, it suggests that by mid-November, #XRP could be around $6 to $7! Fractals can indeed be… pic.twitter.com/HmIlK77Lrr — EGRAG CRYPTO (@egragcrypto) September 18, 2025 Fractal Analysis: The Key to XRP’s Potential Surge Fractals are a popular tool for market analysis, as they can reveal trends and potential price movements by identifying patterns in historical data. Egrag Crypto’s focus on a yellow fractal pattern in XRP’s price charts is central to the current forecast. Having contrasted the market scenario at the current period and how it was at an earlier time, the analyst has indicated that XRP might revert to the same price scenario that occurred at a later cycle in the past. Egrag Crypto’s forecast of $6 to $7 is based not just on the fractal pattern but also on broader market trends and technical indicators. The Fibonacci retracements and extensions will also give more insight into the price levels that are likely to be experienced in the coming few weeks. With mid-November in sight, XRP investors and traders will be keeping a close eye on the market to see if Egrag Crypto’s analysis is true. If the price targets are reached, XRP could experience one of its most significant rallies in recent history. Also Read: Top Investor Issues Advance Warning to XRP Holders – Beware of this Risk The post Egrag Crypto: XRP Could be Around $6 or $7 by Mid-November Based on this Analysis appeared first on 36Crypto.
Share
Coinstats2025/09/18 18:36
‘High Risk’ Projects Dominate Crypto Press Releases, Report Finds

‘High Risk’ Projects Dominate Crypto Press Releases, Report Finds

The post ‘High Risk’ Projects Dominate Crypto Press Releases, Report Finds appeared on BitcoinEthereumNews.com. More than six in 10 crypto press releases published
Share
BitcoinEthereumNews2026/02/04 13:09
Why Vitalik Says L2s Aren’t Ethereum Shards Now?

Why Vitalik Says L2s Aren’t Ethereum Shards Now?

The post Why Vitalik Says L2s Aren’t Ethereum Shards Now? appeared on BitcoinEthereumNews.com. Vitalik says Ethereum’s scaling and higher gas limits mean L2s no
Share
BitcoinEthereumNews2026/02/04 13:18