

Circle Stock Drops to $81 as Visa and Mastercard Back Rival Stablecoin
Circle Stock (CRCL) trades around $81, deep below all major moving averages. Momentum indicators point south. A structural breakdown predates recent competitive headlines. A new rival stablecoin platform backed by Visa, Mastercard, and Stripe intensifies selling pressure on an already-broken chart.
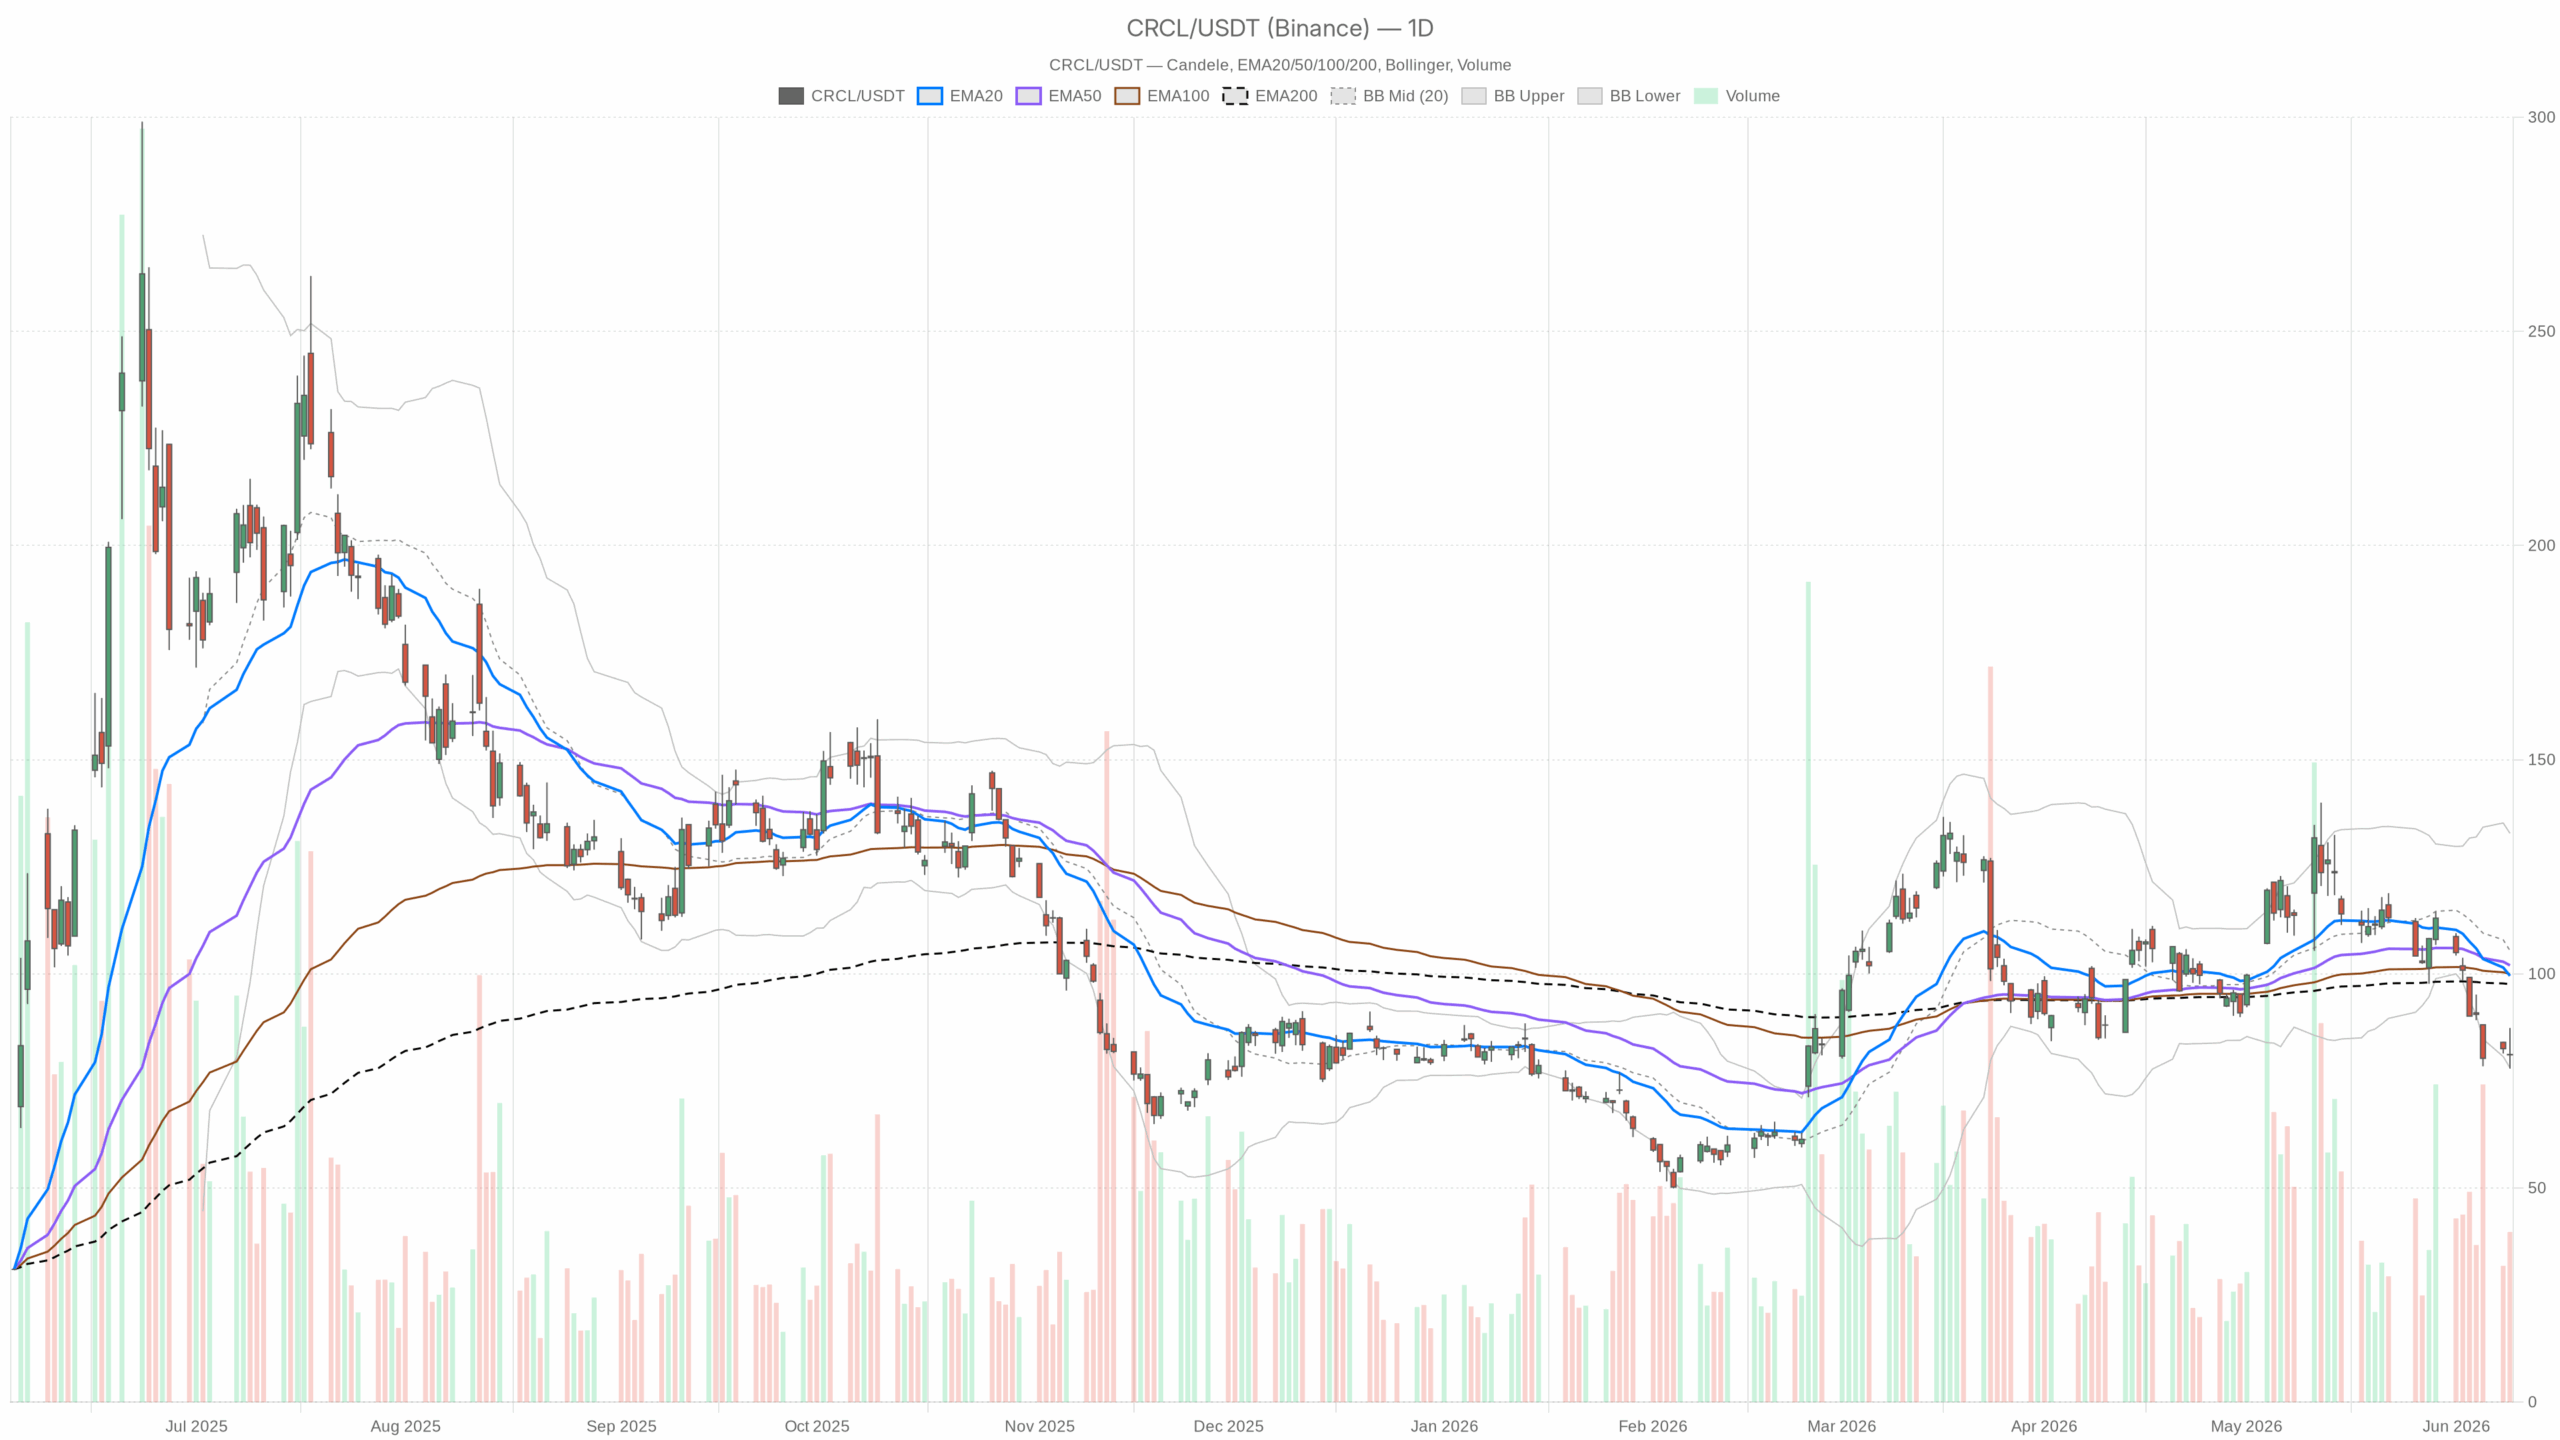 CRCL — daily chart with candlesticks, EMA20/EMA50 and volume.
Circle Stock (CRCL) Technical Structure: Distribution Deepens
Daily Moving Averages Confirm Sustained Selling Pressure
Circle Stock closed at $81.10 on June 9. Price sits well beneath the EMA20 at $99.54, the EMA50 at $101.99, and the EMA200 at $97.60. This full stack of declining averages above price signals sustained distribution. The Bollinger Band midline at $105.43 confirms how extended the downside move has become. Currently, price presses against the lower band at $78.06. That offers near-term support context, but no reversal signal yet.
Momentum Indicators Show No Stabilization
Daily RSI at 34.31 approaches oversold territory but has not crossed below 30. Oversold readings near that threshold can precede technical bounces. However, in genuinely weak trends, RSI can remain depressed for extended periods without meaningful recovery. The MACD tells a more urgent story. The MACD line sits at -6.43, well below the signal at -2.67. The histogram deepens at -3.76. No bullish divergence or momentum stabilization is visible at the daily level. Overall, the daily structure is unambiguously bearish and deteriorating.
Shorter Timeframes Reinforce the Bearish Picture
Hourly Chart: Layered Resistance Overhead
Circle Stock on the 1H chart remains in a bearish regime. Price at $81.08 trades below the EMA20 at $83.18, the EMA50 at $89.82, and the EMA200 at $101.36. This cascade of averages overhead creates layered resistance. Notably, the 1H MACD histogram shows a marginal positive reading of +0.57. This hints at a tiny short-term momentum improvement. Still, it is insufficient to shift the broader picture. The 1H RSI at 36.88 mirrors daily weakness without offering a recovery signal.
Pivot levels tell a similar story. The pivot point sits at $81.29, with R1 resistance at $81.66 and S1 support at $80.71. Price hovers just below the pivot, showing the market has not convincingly reclaimed this short-term reference. A sustained hold below $81.29 keeps the path of least resistance pointed toward the $80.71 support zone.
15-Minute Chart: Brief Consolidation, Not a Reversal
At the 15-minute level, conditions offer slightly more ambiguity — but only for very short-term timing. The 15m RSI at 47.21 is neutral, and the MACD histogram shows a positive +0.16. These readings suggest micro-level stabilization may be underway. However, price remains beneath the 15m EMA200 at $90.86 and EMA50 at $82.16. The ATR at $0.87 indicates low intraday volatility. This looks like brief consolidation before the next directional move rather than a genuine reversal attempt.
Fundamental Threats Compound CRCL’s Technical Weakness
Reports surfaced in early June that Visa, Mastercard, Stripe, and potentially Coinbase are collaborating on a competing stablecoin platform. For a company whose core value proposition rests on USDC dominance, this is not a trivial threat. The market reacted with immediate selling. Meanwhile, the revenue-sharing agreement between Coinbase and Circle — a meaningful part of Circle Stock’s economics — is up for renewal in August. Uncertainty around that renewal adds another layer of fundamental risk that the market is likely pricing in.
Circle Stock Scenarios: Recovery Potential vs. Downside Continuation
What a Bullish Reversal Would Require
For a bullish scenario to materialize, Circle Stock would need to reclaim the daily pivot at $82.12. A sustained push through the $86.36 R1 level would follow. On momentum, the daily RSI would need to stabilize and curl higher, while the MACD histogram stops widening. Positive news flow could catalyze a recovery. Clarity on the Coinbase renewal — or signs the rival stablecoin initiative loses momentum — would help. Daily ATR at $7.68 confirms significant range-of-move potential if buyers arrive decisively.
Bearish Continuation Remains the Base Case
Still, the bearish scenario remains the path of least resistance. A failure to hold the $80.71 hourly support would open the door to deeper losses. A break beneath the daily Bollinger Band lower boundary at $78.06 would confirm further downside. No bullish momentum signal exists on the daily chart, meaning sellers remain in firm control. If the competitive landscape for USDC worsens further, Circle Stock could remain under heavy fundamental selling pressure. A contentious Coinbase renewal would add to that pressure, regardless of short-term technical stabilization.
Circle Stock Outlook: Downtrend Intact
In sum, Circle Stock is in a confirmed downtrend, trading well below all key moving averages. Momentum continues to weaken. Genuine competitive threats are rewriting the fundamental thesis. Short-term noise may produce brief bounces. The near-oversold daily RSI keeps a technical snap-back possible. However, the weight of evidence — across timeframes and in the news — favors caution. Volatility remains elevated given the daily ATR at $7.68. Macro uncertainty around USDC’s competitive moat makes directional conviction difficult to sustain in either direction without fresh catalysts.


You May Also Like

BTC Price Shaky Near $67K While Oil Surges on Middle East Tensions: What's Next? (April 2 Update)

One Of Frank Sinatra’s Most Famous Albums Is Back In The Spotlight

LIST: Bayanihan initiatives amid soaring oil prices


