

Dogecoin (DOGE) Price: The Same Indicator That Called the Last Crash Is Now Flashing a Buy
TLDR
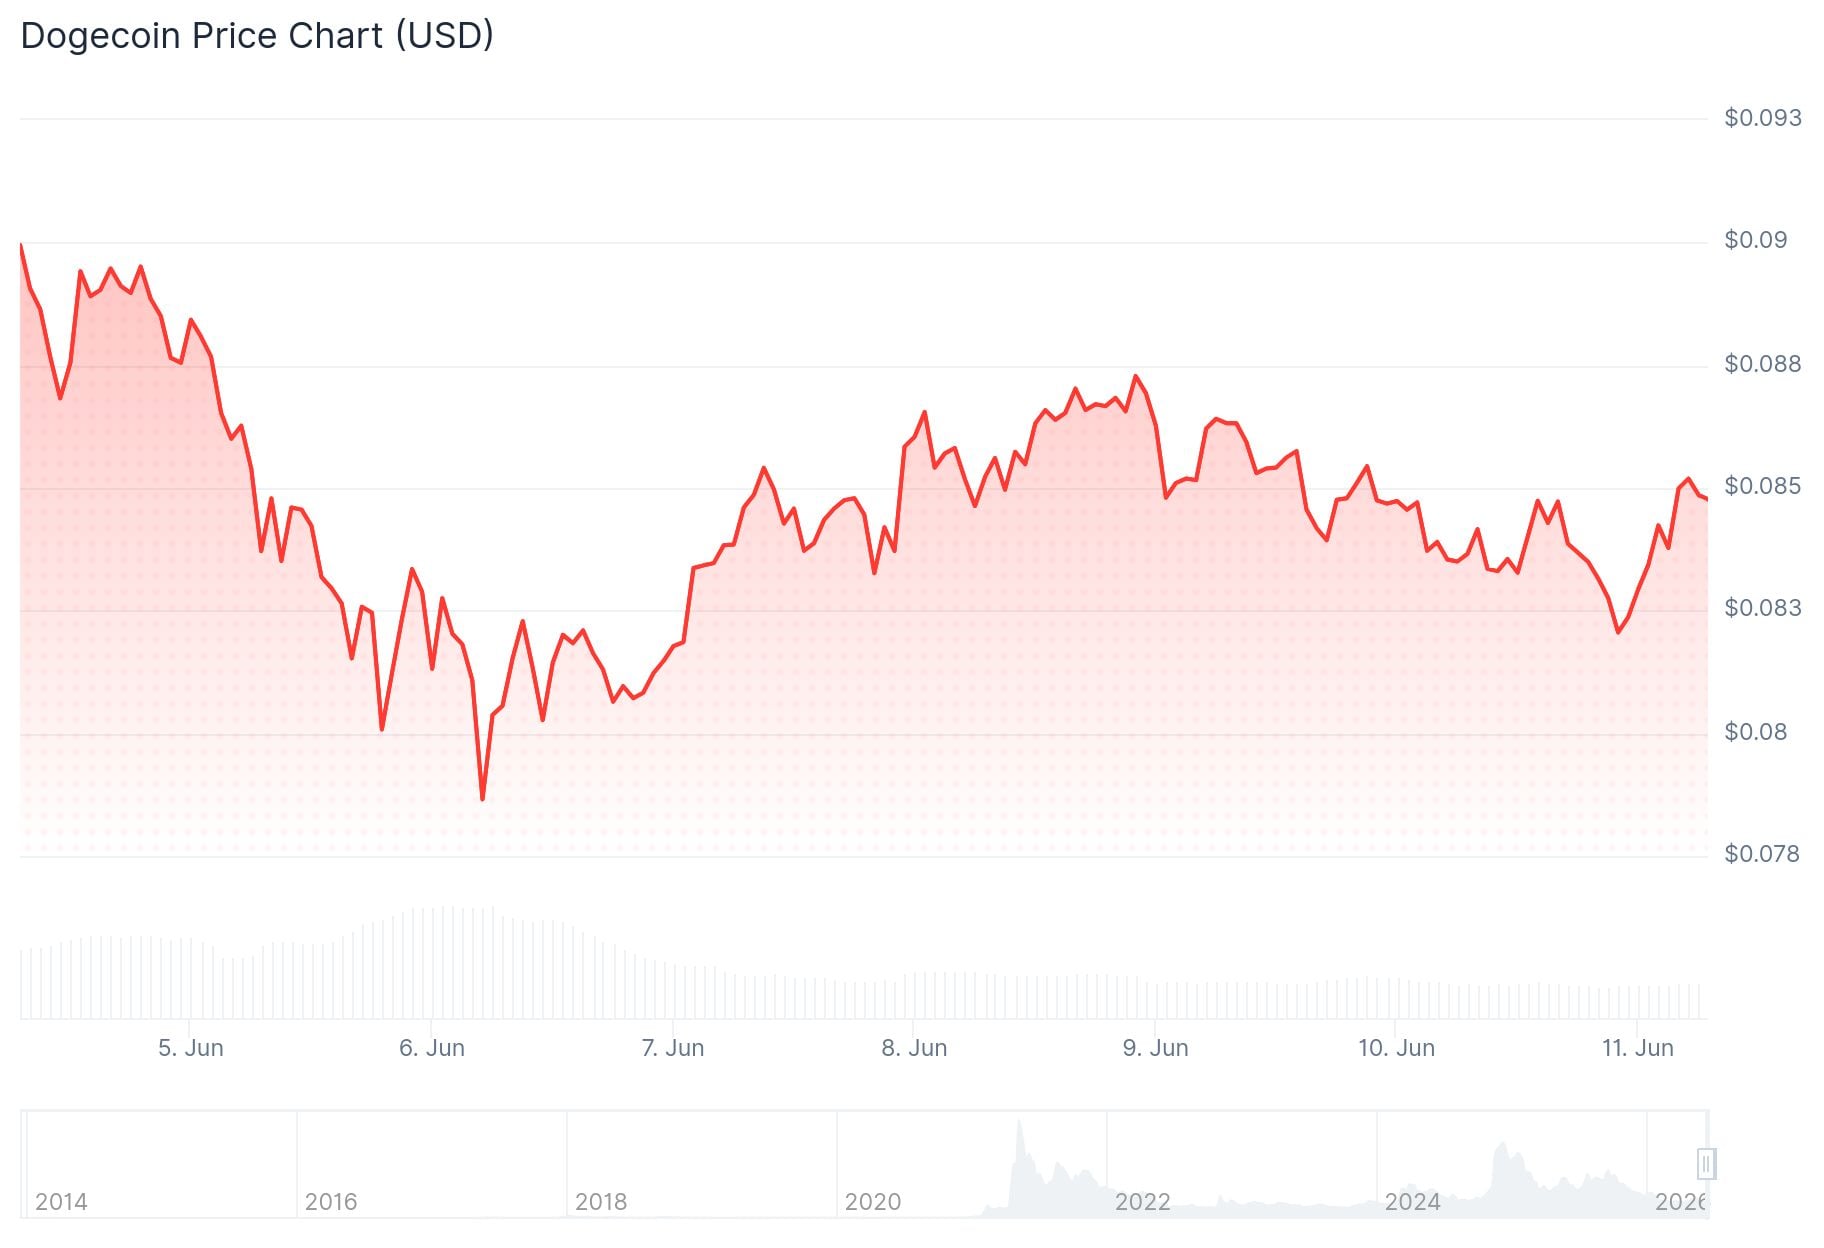
- DOGE is trading around $0.083, down 2% in 24 hours, with a market cap of $14.21 billion.
- On-chain data shows 30 billion DOGE last transacted near $0.081, forming a strong cost-basis support zone.
- Analyst Ali Charts says the Tom DeMark Sequential indicator has flashed a buy signal on DOGE — the same indicator predicted a 31% drop in May before it happened.
- MACD has crossed below its signal line, Bollinger Bands expanded, and price fell below the 20-period moving average — all confirming bearish momentum.
- Open interest dropped 3.12% to $1 billion and trading volume fell, pointing to cautious market sentiment.
Dogecoin peaked at $0.117 in May 2026 before sharp selling pressure sent it tumbling through key technical levels. As of June 11, 2026, DOGE is trading at $0.08356, a 2.01% drop over the past 24 hours. Market cap sits at $14.21 billion with $593 million in daily trading volume.
 Dogecoin (DOGE) Price
The decline has been technical in nature. DOGE broke below its 20-period simple moving average at $0.09440 and slipped under the lower Bollinger Band. The Bollinger Bands themselves expanded rapidly, a sign of sudden volatility as sellers stepped in.
The MACD confirmed the bearish picture. The MACD line crossed below its signal line and moved into negative territory, with histogram bars growing larger. That indicates selling pressure is building, not fading.
$0.081: A Key Level to Watch
On-chain analyst Ali Charts has identified $0.081 as a critical price zone. Over 30 billion DOGE tokens were last transacted at that level, creating what’s known as a cost-basis cluster. Most holders in that zone are near break-even, which could trigger buying if the price revisits that level.
This makes $0.081 both a psychological and technical line in the sand. Traders are watching it closely to see if buyer demand shows up or if the level breaks.
The same analyst, Ali Charts, recently shared a tweet noting that the Tom DeMark Sequential indicator flashed a sell signal on May 7 — which preceded a 31% correction from $0.113 to $0.078. That same indicator has now flipped to a buy signal, suggesting a potential rebound may be forming. Ali Charts is one of the more watched voices in on-chain analysis, and this signal is drawing attention given its recent track record.
Long-Term Pattern Drawing Comparisons to 2021
Crypto analyst Trader Tardigrade has pointed out a longer-term structure on DOGE’s monthly chart. The setup mirrors the pattern seen between 2014 and 2017, which preceded the coin’s massive 2021 rally — a run that peaked at roughly 29,000% from its 2015 lows.
Dogecoin started 2021 at around $0.004 and hit its all-time high in May that year, a gain of over 18,000% in five months. The analyst argues that the current falling wedge compression on the monthly chart resembles the same pre-breakout structure.
The projected scenario maps a potential breakout, a pullback, and then a larger expansion phase later in the cycle. Projected targets cited include a range of $3 to $5, with a possible push even higher.
Derivatives data adds more caution to the near-term picture. Open interest fell 3.12% to $1 billion while trading volume dropped 7.97% to $1.35 billion.
Recent real-world adoption developments include House of Doge and MoonPay announcing a partnership to enable DOGE payments at over 6,000 merchants.
The post Dogecoin (DOGE) Price: The Same Indicator That Called the Last Crash Is Now Flashing a Buy appeared first on CoinCentral.


You May Also Like

Michael Saylor and Jack Mallers Clash Over Strategy’s Bitcoin Reporting Metrics

Trump says US will hit Iran ‘very hard tonight’

Canton Developer Digital Asset Raises $355M as Wall Street Doubles Down on Blockchain Infrastructure


