

Blackberry Stock Holds Bullish at $8.82 — But Hourly Charts Disagree

Blackberry stock is sending a clear bullish message on the daily chart. Trading at $8.82 on June 10, BB holds well above all three major daily EMAs, confirming a structural uptrend. The fundamental picture reinforces this: BlackBerry’s turnaround is complete, with QNX and AI cybersecurity now driving growth.
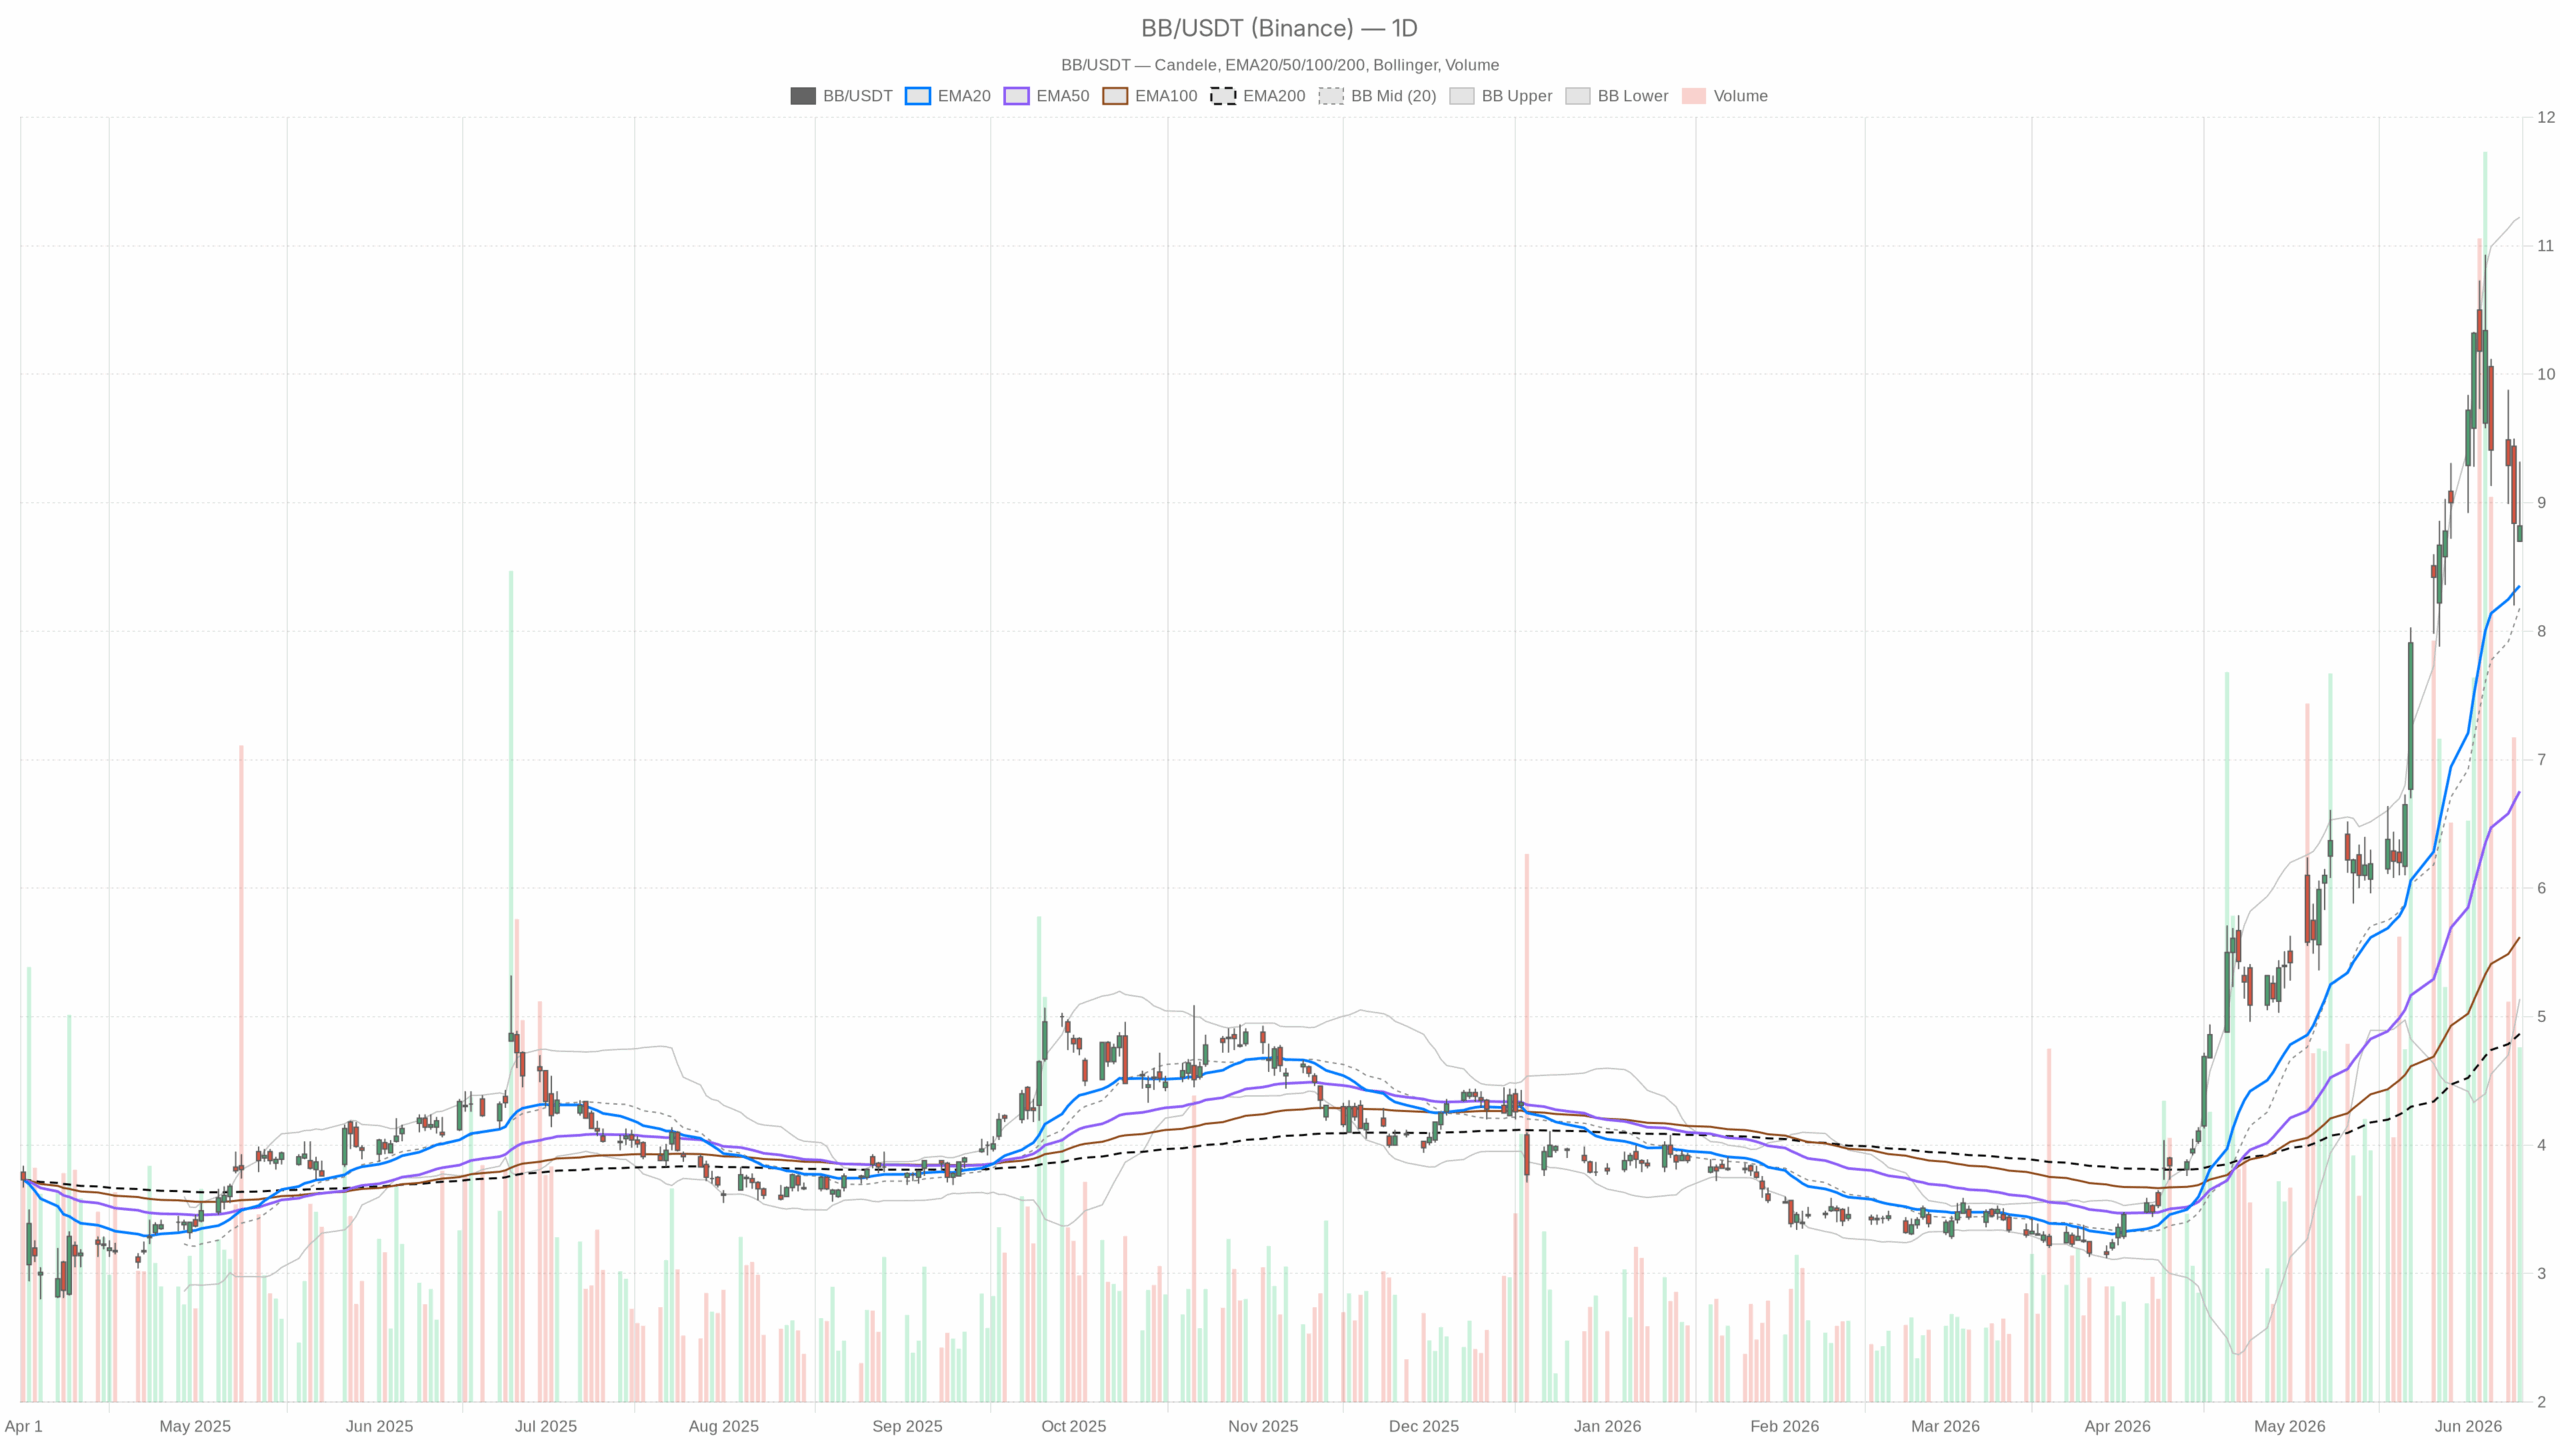 BB — daily chart with candlesticks, EMA20/EMA50 and volume.
BlackBerry Stock Daily Outlook: Momentum Is Real, Though Starting to Breathe
Momentum Indicators Hold Bullish, with Early Signs of Deceleration
The daily RSI14 reads 62.11 — solidly in bullish territory without tipping into overbought excess above 70. That positioning suggests the trend still has room to run before exhaustion becomes a real concern. However, the MACD histogram has dipped slightly negative at -0.07. The MACD line at 0.99 has barely crossed below the signal line at 1.07, signaling short-term deceleration rather than reversal. Price is digesting recent gains, not abandoning them.
Bollinger Bands on the daily frame are notably wide. The upper band sits at $11.22, the lower at $5.14, reflecting the volatility expansion that has accompanied this rally phase. The midline at $8.18 is well below current price, confirming BB is trading in the upper half of its recent range — a structurally positive position. The ATR14 of $0.95 underscores that daily swings remain meaningful. Traders should expect continued intraday volatility rather than a calm drift.
Daily pivot analysis places the pivot point at $8.95, with R1 resistance at $9.19 and S1 support at $8.57. The June 10 close at $8.82 sits just below the daily pivot, suggesting bulls were unable to fully reclaim that level by the session’s end. Meanwhile, the intraday high reached $9.32, tagging above R1 before pulling back — a sign of active selling interest at that level.
Hourly Timeframe: The Trend Weakens, Conflict Emerges
EMA Structure Flips Neutral on the Hourly Chart
Shifting to the 1-hour chart, the picture becomes notably more complicated. Price at $8.84 is trading below the H1 EMA20 at $9.06 and below the EMA50 at $9.21. The 1H EMA200 at $7.80 remains supportive from below. However, the slip under shorter-term hourly averages signals a meaningful intraday pullback from recent highs. The hourly regime is classified as neutral — a clear downgrade from the bullish daily signal.
Momentum and Range Analysis
The 1H RSI at 42.79 reinforces this softer tone. It is not oversold, but it is drifting toward the lower half of the neutral band. The MACD on the hourly chart is negative, with the line at -0.18 and the signal at -0.21. Notably, the histogram has turned slightly positive at +0.03. That small uptick hints at a potential deceleration in bearish momentum at the hourly level, without yet confirming a recovery.
In contrast to the wide daily Bollinger Bands, the 1H bands are much tighter. The upper band sits at $9.59, the midline at $8.98, and the lower at $8.38. Price is below the midline, again reflecting near-term selling pressure. The 1H pivot point at $8.86 is very close to current levels, with R1 at $8.89 and S1 at $8.80. This extremely compressed pivot range implies limited short-term directional conviction at the hourly level.
15-Minute Timeframe: Bearish Micro Structure
The 15-minute timeframe adds another layer of caution for near-term entries. Price is trading below all three key EMAs on this frame — the EMA20 at $8.94, EMA50 at $8.98, and EMA200 at $9.27. The 15m regime is explicitly bearish. RSI sits at 42.71, consistent with the 1H reading. The MACD histogram is slightly negative at -0.02. The line and signal both hug near zero, offering no strong directional signal at this granularity.
Overall, the 15-minute structure is consistent with a market that has retraced from a short-term peak and is consolidating. It does not yet show signs of a base forming for the next leg higher. For traders looking for intraday entry points, this timeframe suggests waiting for a cleaner setup rather than chasing the current price.
Bullish Scenario: The Trend Has Legs
The primary bullish case for Blackberry stock rests on the integrity of the daily uptrend. As long as BB holds above the daily EMA20 at $8.35, the structure remains intact. Reclaiming the daily pivot at $8.95 and breaking above R1 at $9.19 would confirm bulls have absorbed the intraday pullback. That would open the path toward the $9.50–$10.00 zone.
Continued positive newsflow around QNX adoption, new AI partnerships, or further government contract wins could act as catalysts. Meanwhile, the buyback extension provides a structural floor under price during any dips.
On the hourly chart, a recovery above the 1H EMA20 at $9.06 would signal that intraday bearish pressure is fading. That level becomes the first meaningful confirmation hurdle for bulls operating on a swing-trade basis.
Bearish Scenario: Where the Thesis Breaks Down
The bullish thesis on Blackberry stock is not without risk. A sustained failure to reclaim the daily pivot at $8.95, combined with continued hourly MACD deterioration, could invite a deeper retest of daily S1 at $8.57. Below that, the daily EMA20 at $8.35 would be the key technical line in the sand. A daily close beneath the EMA20 would meaningfully weaken the bullish structure and open the door to extended consolidation.
At the same time, the slight daily MACD negative histogram reading warrants close monitoring. If the MACD line diverges further below the signal, a momentum rollover could begin at the daily level. This would not signal a reversal, but potentially weeks of sideways-to-lower price action before the next meaningful move upward.
Positioning and Volatility Outlook
Blackberry stock’s setup is one of a structurally bullish daily trend experiencing a natural intraday pullback after a sharp run higher. The multi-timeframe conflict — bullish on the daily, neutral on the hourly, bearish on the 15-minute — is entirely consistent with a stock digesting gains rather than reversing direction.
The ATR14 of $0.95 on the daily frame demands respect. Position sizing should account for meaningful daily swings. Overall, the key pivot at $8.95 is the immediate reference point. How price behaves around that level in coming sessions will define the next directional leg with more clarity than any single indicator in isolation.


You May Also Like

Best ai blockchain presale: 9 Projects for 2026

Crypto Presale NFT Project: 10 Tokens for 2026

SpaceX IPO exposes hidden risks for SPV investors: Shares may be delayed or lost


