

XRP Price: TD Sequential Buy Signal Fires on 3-Day Chart — Here’s the Target Zone
TLDR
- XRP held the $1.10 support level on June 11 and traded near $1.12 after a late-session volume surge
- A three-wave impulse pattern targets a recovery zone between $2.39 and $3.11
- Analyst Ali Charts flagged a TD Sequential buy signal on XRP’s 3-day chart, pointing to a short-term rebound
- XRP-linked ETFs recorded $1.19 million in daily net inflows, with total assets near $948.98 million
- Key resistance sits at $1.12–$1.13, with the $1.2380 mid-Bollinger Band the next major recovery level
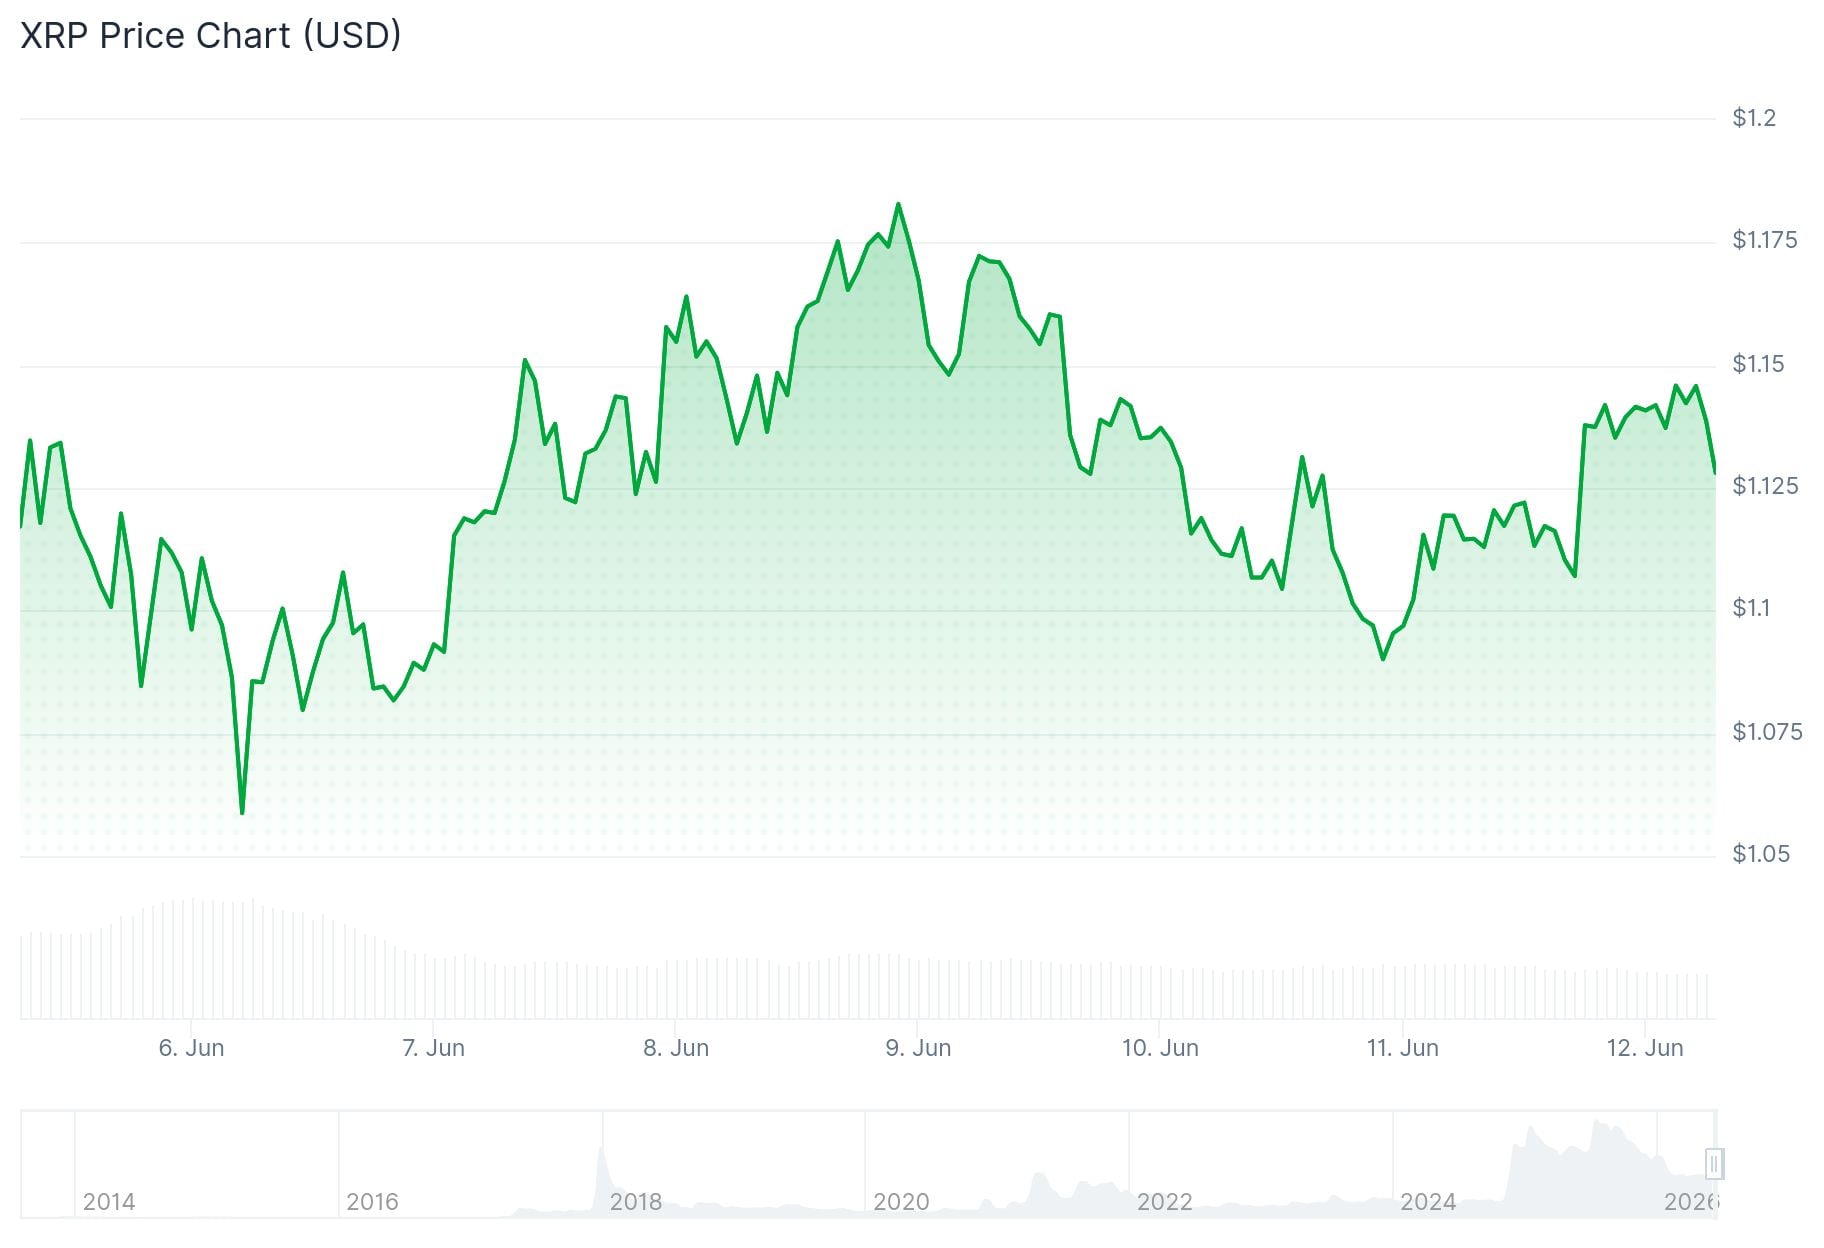
XRP held above $1.10 on June 11 after a volatile session, trading near $1.12 with 24-hour volume around $1.94 billion. The token gained 0.72% on the day but remained down 4.47% over the past week and 23.86% over the past month. Its market cap sat near $69.2 billion, keeping it ranked sixth by total market value.
 XRP Price
The price action shows buyers defended the $1.10 zone following last week’s sharp decline. That level now acts as the key short-term support, sitting close to the most recent breakdown low.
Analyst Ali Charts posted on X that the TD Sequential indicator printed a buy signal on XRP’s 3-day chart. According to the analyst, a high-timeframe signal like this has historically led to a one-to-four candlestick rebound, offering short-term relief after recent market compression.
XRP briefly pushed above $1.12 during late-session trading on stronger volume. Earlier in the day it hovered near $1.11, where buyers tried to build a base.
The $1.12–$1.13 zone is the first resistance area traders are watching. A close above $1.13 on higher volume could open the door to $1.18 and then $1.2380. If XRP drops below $1.10, the next levels to watch are $1.09 and the lower Bollinger Band near $1.04.
Technical Setup Points to $2.39–$3.11 Target
One technical chart shared on X by analyst RWA_Investor lays out a possible three-wave recovery structure from the recent low near $1.07. The setup shows Wave A pushing toward $1.94, followed by a Wave B pullback to around $1.46, and a final Wave C targeting a zone between $2.39 and $3.11.
Wave B pulling back to $1.46 would not be a bearish sign, according to the chart. It would be a normal shakeout before the strongest leg of the move.
A break and close above $3.10 would suggest that XRP’s macro bottom is already in at the $1.05 area. If the recovery stalls below the upper target band, analysts have pointed to a possible revisit of the $0.75–$1.00 range as an alternate downside scenario.
ETF Inflows Rise as Momentum Stays Weak
XRP-linked investment products saw $1.19 million in daily net inflows according to SoSoValue data, with total net assets near $948.98 million. The inflows are a mild positive but assets remain below earlier highs.
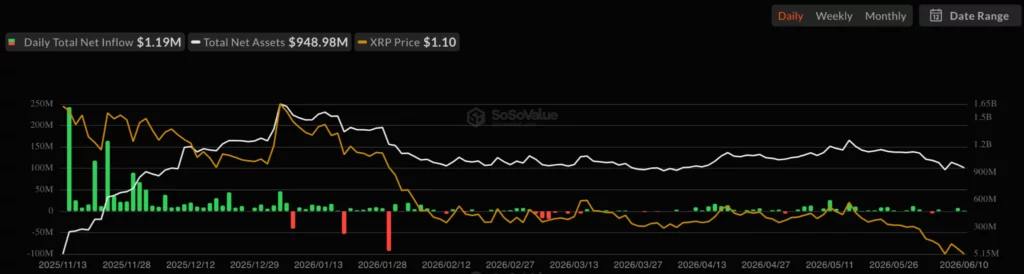 Source: SoSoValue
Open interest stayed near cycle lows, suggesting traders are not yet building strong directional positions. Volume is picking up, but the market appears to be moving in short-term trades rather than steady trend-following.
The daily chart remains in a downtrend from January highs above $2.30. XRP consolidated between March and May before breaking lower in June. The middle Bollinger Band at $1.2380 is the level bulls need to reclaim to suggest a more durable recovery is forming.
The post XRP Price: TD Sequential Buy Signal Fires on 3-Day Chart — Here’s the Target Zone appeared first on CoinCentral.


You May Also Like
Dollar Weakens as Trump Announces Imminent Iran Peace Agreement, Crude Tumbles

British Pound Steady After BoE Hold, But Hawkish Risks Are Rising: Deutsche Bank

LBank to Host Argentina vs Austria VIP Matchday at AT&T Stadium During FIFA World Cup 2026


