Jefferies ($JEF) Stock: Revenue Surges 22% as Deal Advisory Hits Record
TLDR
- s ($JEF) reported Q3 2025 EPS of $1.01 vs. $0.80 estimate.
- Revenue rose 21.6% YoY to $2.05B, beating forecasts.
- Advisory net revenue hit a record $656M on strong M&A.
- Debt underwriting jumped 36% to $249.5M.
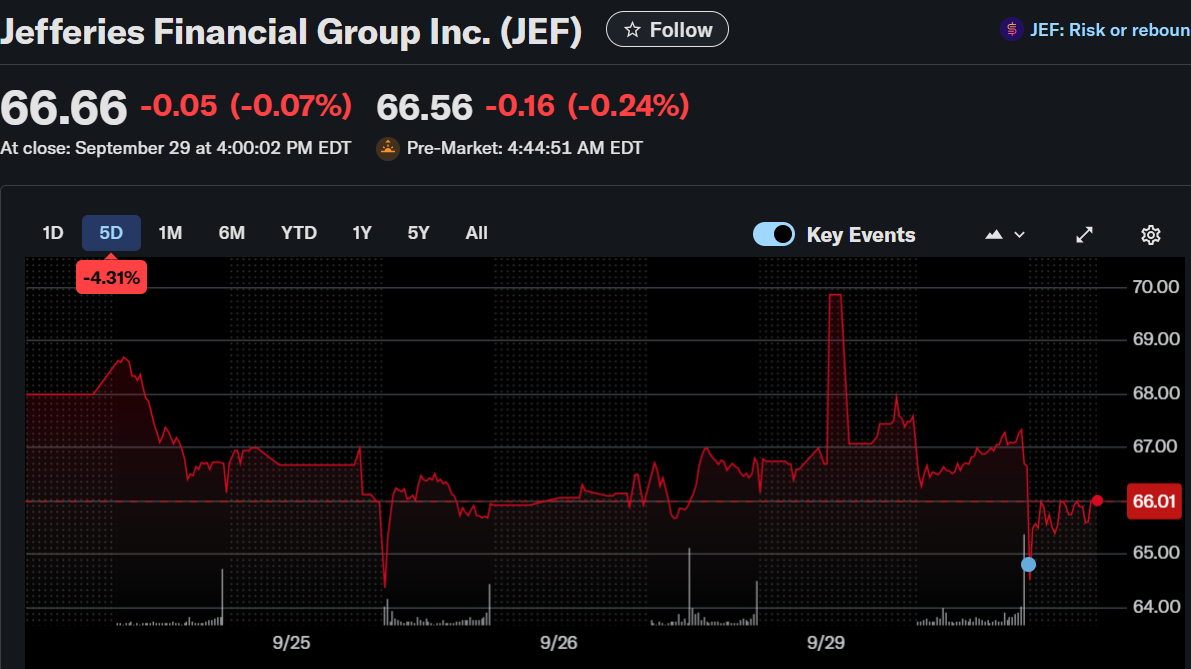
- Stock closed at $66.66 on Sept. 29, down 0.07%, slipping afterhours.
Jefferies Financial Group Inc. (NYSE: JEF) closed at $66.66 on September 29, 2025, down 0.07%, before slipping further in afterhours trading despite posting fiscal third-quarter results that surpassed Wall Street expectations.
Jefferies Financial Group Inc. (JEF)
For the quarter ended August 31, 2025, the investment bank reported earnings of $1.01 per share and revenue of $2.05 billion. Analysts had expected $0.80 per share and $1.89 billion in revenue.
Net earnings attributable to common shareholders rose to $224 million from $167.1 million a year earlier, reflecting both revenue growth and improved profitability. Pre-tax profit reached $331.8 million, translating to a margin of 16.2%.
Record Advisory Revenue and Deal Activity
A major highlight was advisory net revenues, which surged 10.7% year-over-year to a record $655.6 million. Jefferies attributed the performance to higher deal values across most sectors, supported by a more favorable environment for mergers and acquisitions. President Brian Friedman highlighted confidence in continued M&A growth, citing improving interest rates and resilient business sentiment.
Global dealmaking reached $2.6 trillion in the first seven months of 2025, the highest since the 2021 pandemic-era peak. Jefferies noted that corporate-driven M&A has been strong, with private equity and sponsor-backed transactions expected to pick up in 2026.
Underwriting Growth
Equity and debt underwriting revenues also delivered robust results. Debt underwriting revenue rose 36.3% year-over-year to $249.5 million, up from $183 million. Equity underwriting climbed 20.7%. Both segments benefited from stronger capital markets activity as financing conditions improved.
Revenue Growth Trends
Jefferies posted a 21.6% year-over-year revenue increase, signaling accelerating demand compared to its five-year average growth of 6.6%. While longer-term performance has been mixed, the company’s two-year revenue CAGR of 21% indicates momentum in its core businesses.
Performance Overview
Despite strong earnings, Jefferies stock underperformed broader markets in 2025. Year-to-date, JEF is down 13.26% compared to the S&P 500’s 13.25% gain. Over a three-year horizon, however, JEF delivered a 161.87% return, well above the S&P 500’s 82.98%. The five-year return is even more impressive at 351.8%, significantly outperforming the benchmark’s 99.71%.
Outlook
Management pointed to a solid backlog, with expectations for stronger sponsor-driven M&A activity in 2026. With rate cuts on the horizon, financing conditions may further support advisory and underwriting businesses. Results from larger peers including Goldman Sachs, Morgan Stanley, and JPMorgan Chase, due next month, will provide broader insight into Wall Street’s dealmaking recovery.
The post Jefferies ($JEF) Stock: Revenue Surges 22% as Deal Advisory Hits Record appeared first on CoinCentral.


You May Also Like

XRP Price About to Explode? This Setup Says Yes

USD/JPY Intervention Alert: Critical 160 Level Raises Stakes for Bank of Japan