

Ethereum (ETH) Reaches Historical Oversold Territory as Price Stabilizes Near $1,700
Key Takeaways
- Ethereum is currently priced between $1,665 and $1,680, experiencing a 0.63% decline over 24 hours with a market capitalization of $201 billion
- Crypto analyst Ash Crypto highlights that ETH has reached unprecedented oversold territory throughout its entire existence
- The monthly Relative Strength Index has fallen below levels witnessed during the 2018 and 2022 bear market bottoms
- A recovery bounce from $1,603 has established a bullish trend line with critical support positioned at $1,665
- Critical resistance zones are located at $1,740–$1,780, with potential upside objectives at $1,850 and $1,920
Ethereum is currently hovering between $1,665 and $1,680 following a temporary rebound from its recent swing low at $1,603. The digital asset has declined 0.63% during the past 24 hours, recording a trading volume of $10.20 billion and maintaining a market capitalization of $201.17 billion.
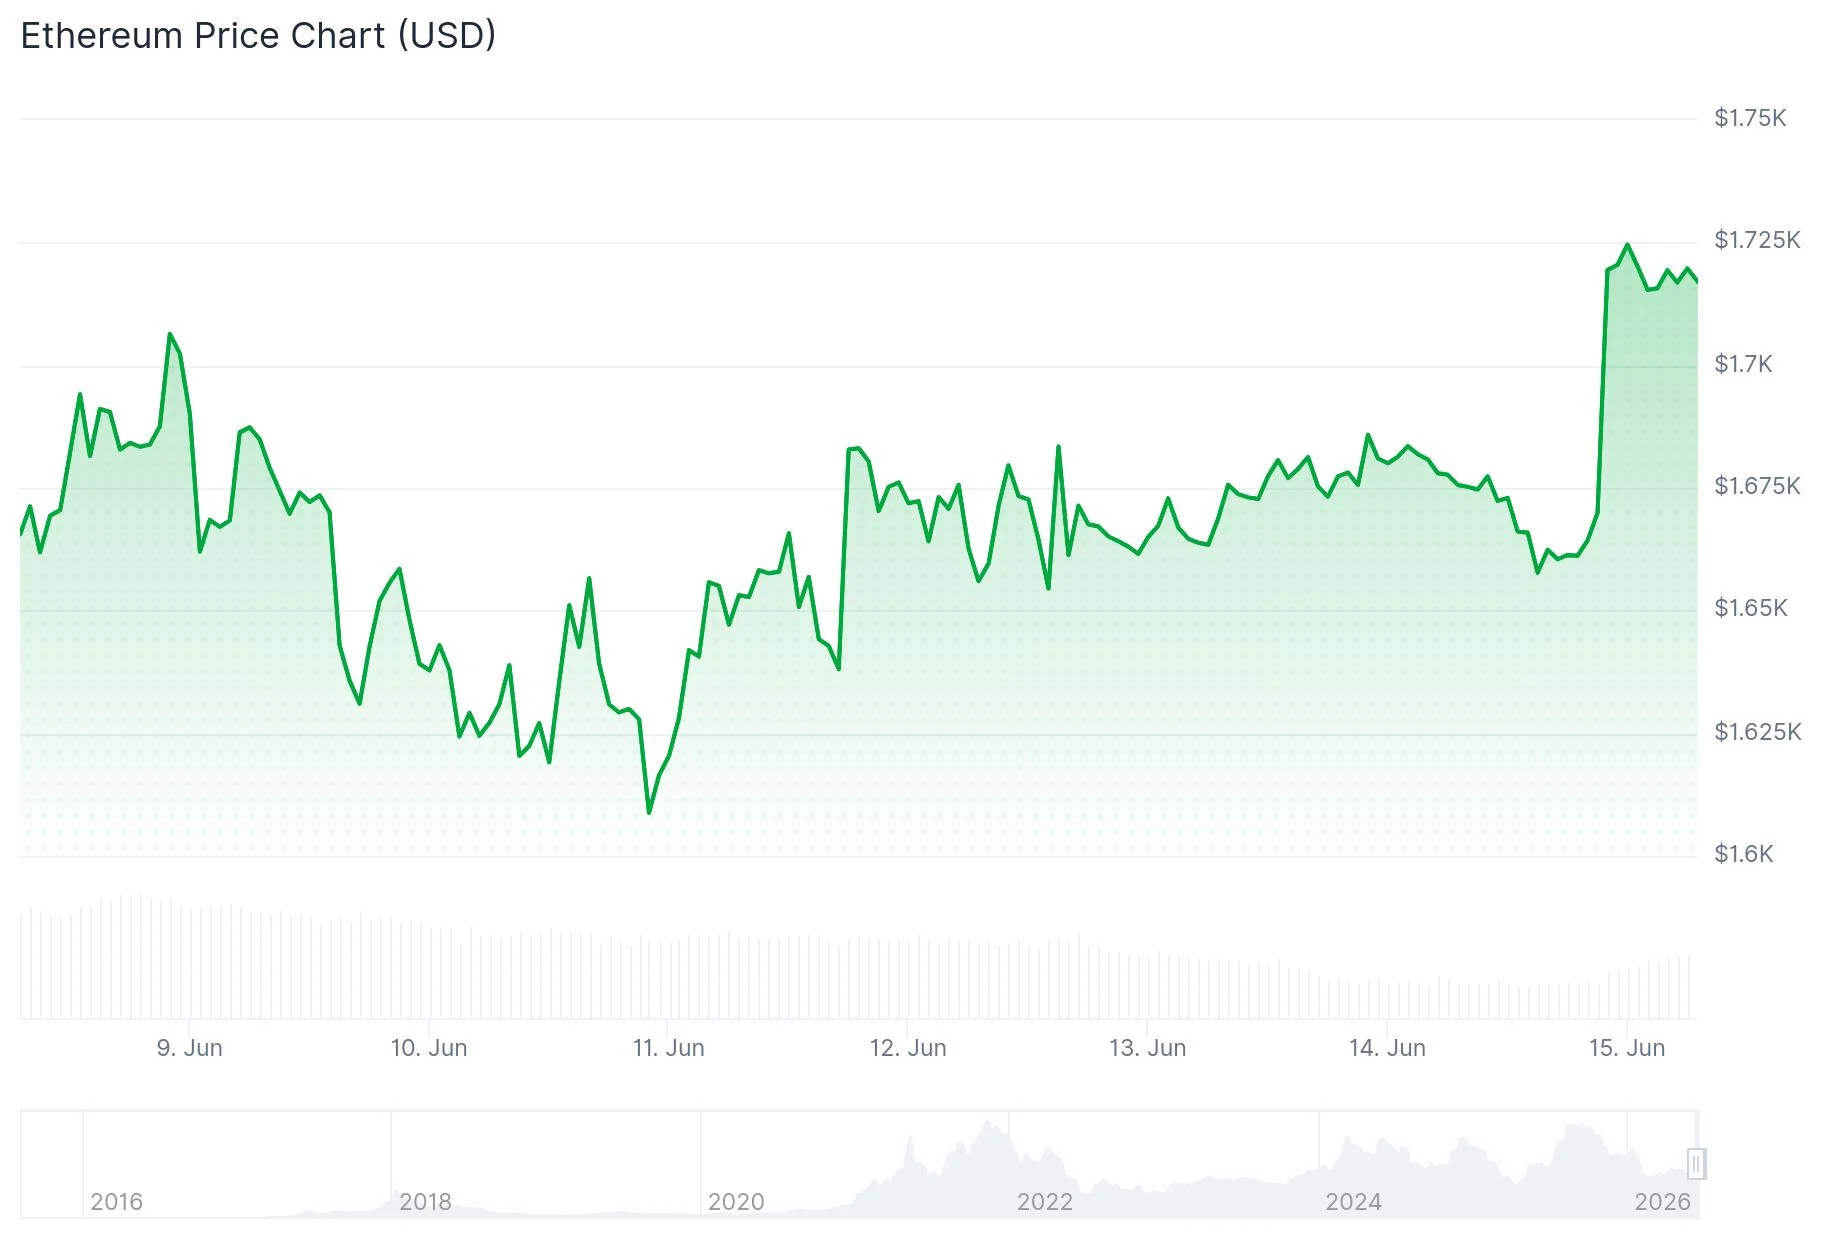 Ethereum (ETH) Price
The cryptocurrency surged to a peak of $1,731 before experiencing a pullback. Currently, ETH is consolidating above the 23.6% Fibonacci retracement level derived from the upward movement spanning $1,603 to $1,731.
On June 14, 2026, cryptocurrency analyst Ash Crypto shared that Ethereum has entered “the most oversold” condition ever witnessed in its market history. His analysis reveals that ETH has plummeted approximately 70% from its prior all-time high and is now exchanging hands at price points not seen for four years.
Ash Crypto further emphasized that the monthly RSI indicator has descended to levels beneath those documented during the bear markets of 2018 and 2022. He drew parallels to June 2022, when Ethereum established a bottom after experiencing an 82% decline from its peak value.
Analyst Ted Pillows observed that ETH has successfully breached its near-term downward trend. According to his assessment, clearing the $1,700 threshold could potentially trigger a surge toward the $1,850–$1,900 price zone.
Critical Technical Levels Under Observation
ETH is maintaining its position above the 100-hourly Simple Moving Average alongside a bullish trend line providing support at $1,665. This trend line coincides with the 50% Fibonacci retracement level calculated from the $1,603 to $1,731 price movement.
The first resistance barrier stands at $1,720, with subsequent levels positioned at $1,740 and $1,780. Successfully breaching $1,780 could propel ETH toward $1,850. Additional upside targets are identified at $1,880 and $1,920.
Regarding downside risk, inability to overcome the $1,740 resistance could result in ETH retreating to the $1,680 support zone. A breakdown beneath $1,665 would activate the $1,650 level, followed by $1,620, with $1,600 representing the crucial support floor.
Momentum Indicators Signal Potential Reversal
The MACD histogram displays a positive reading of 3.15, indicating that downward pressure may be diminishing. The MACD line is positioned at -126.82, while the signal line rests at -129.97, suggesting a modest bullish divergence.
The Bollinger Bands previously captured Ethereum approaching the lower band vicinity of $1,456.90 during intense selling activity. The $1,802.52 level has emerged as an important resistance point on this indicator.
ETH is presently trading above $1,680 while defending the 100-hourly moving average as market participants work to preserve the short-term recovery momentum.
The post Ethereum (ETH) Reaches Historical Oversold Territory as Price Stabilizes Near $1,700 appeared first on Blockonomi.


You May Also Like

BitGo Launches Stablecoin Minting and Redemption Service for Institutions

Web3’s Transaction Privacy Is Stuck Between Mass Adoption and Regulation. Is There a Sweet Spot?

Higher Education Ministry weighs legal action after Haim Hilman alleges ‘backdoor’ entry into public universities


