

Morgan Stanley Upgrades Ferrari Stock — Can RACE Break Past $374?
Morgan Stanley upgrades Ferrari stock, tilting the fundamental narrative bullish for RACE. Yet the stock remains pinned below its 200-day EMA — a structural ceiling. The price action is still settling its verdict.
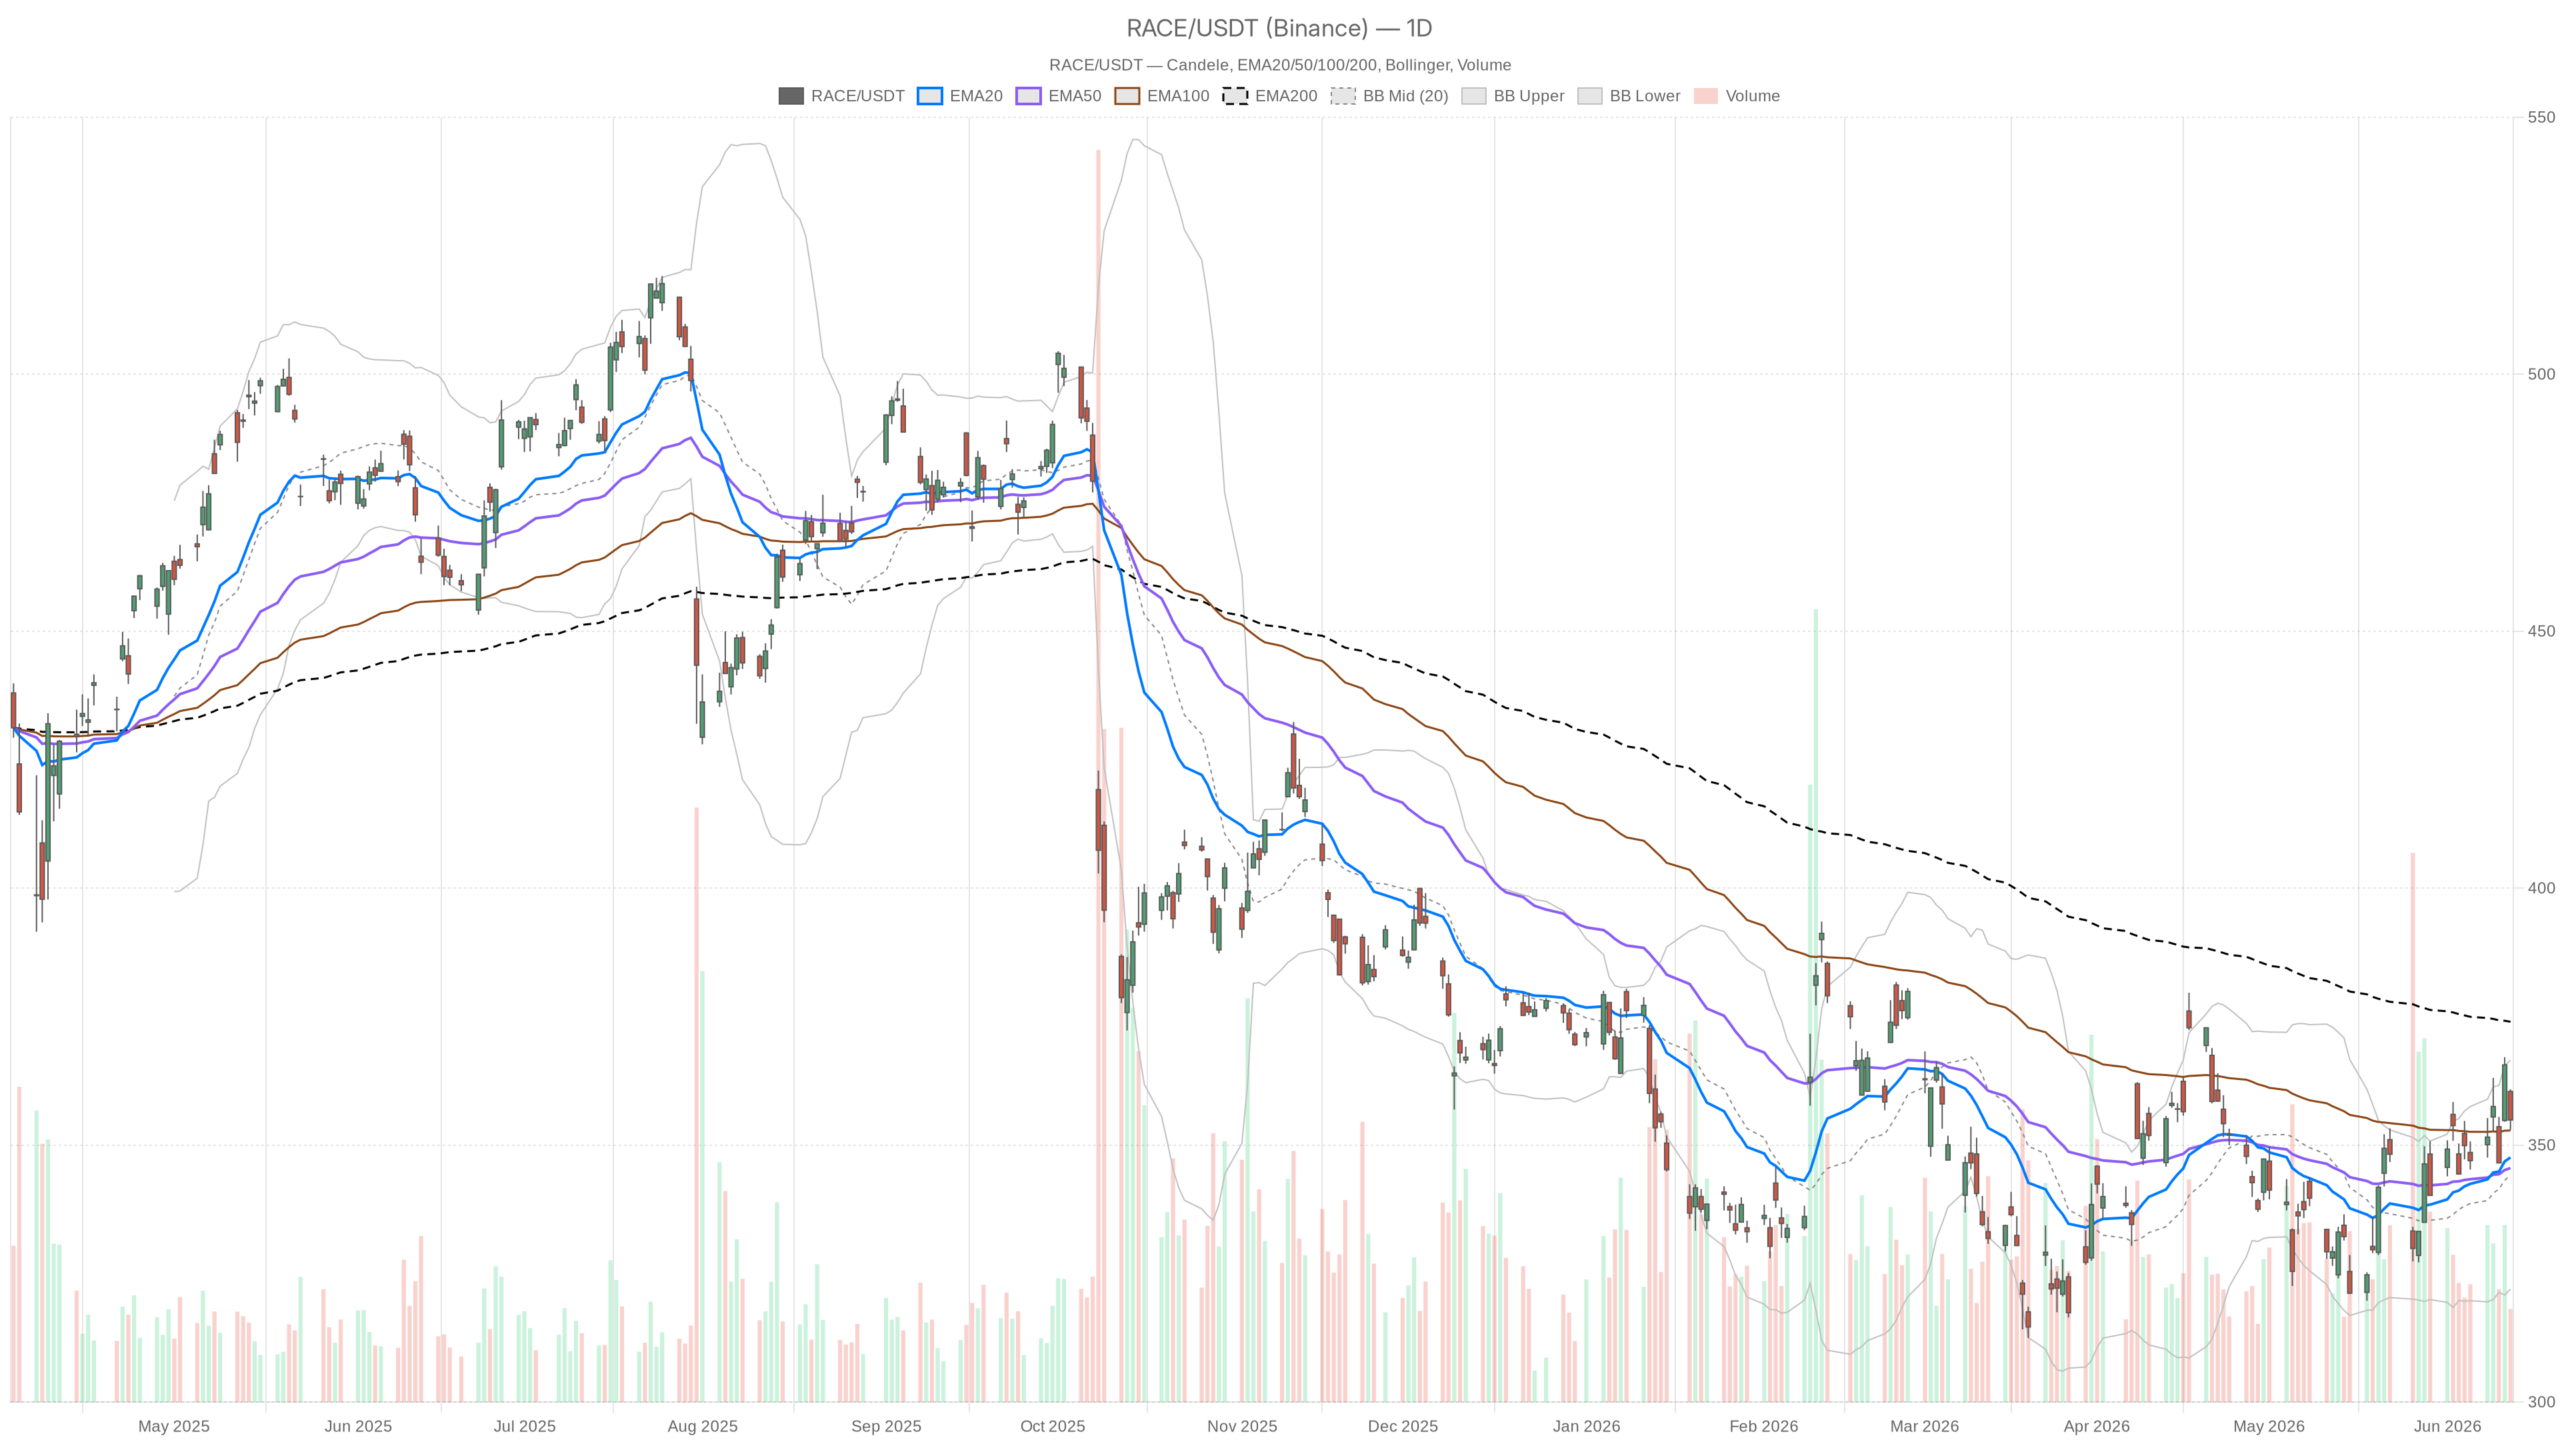 RACE — daily chart with candlesticks, EMA20/EMA50 and volume.
Key takeaways
- Morgan Stanley’s upgrade provides a fundamental catalyst for RACE, but the 200-day EMA at $374.01 remains the defining barrier.
- The daily MACD is positively configured with a $1.78 histogram, signaling accumulation pressure beneath the surface.
- RACE closed at $354.91 on June 12, just below its daily pivot of $356.26 — a level bulls must reclaim to confirm control.
- Hourly momentum has cooled, with the 1H MACD turning slightly negative; entry timing requires patience.
- A breakdown below $351.64 (S1 support) would weaken the bullish case and expose the 20-day EMA near $347.61.
Ferrari Holds Ground After Morgan Stanley Upgrade, But the Real Test Lies Ahead
The Morgan Stanley upgrade has improved RACE’s fundamental backdrop. However, the stock has yet to prove it can clear its most significant technical hurdle — the 200-day EMA at $374.01.
As of June 12, RACE closed at $354.91, off its session high of $360.88. That intraday rejection matters. The stock briefly pushed toward the upper Bollinger Band on the daily chart at $366.54 but pulled back. Sellers remain active near resistance levels. RACE sits above its key short-term moving averages on the daily chart. Yet it remains pinned below its longer-term trend line. This setup defines the core tension facing the stock right now.
Daily Bias Remains Constructive After Morgan Stanley Upgrade
RACE’s daily chart shows a cautiously constructive structure anchored by short-term EMA support, though the long-term trend remains unresolved.
Trend Structure: EMAs Define the Battle Lines
The daily timeframe establishes the primary framework. RACE trades comfortably above both its 20-day EMA at $347.61 and 50-day EMA at $345.55. That separation is meaningful. It signals that recent momentum has been building, not fading. The stock has cleared both short-term trend markers by a notable margin.
However, the 200-day EMA at $374.01 looms significantly above current price. That long-term average acts as a structural ceiling. Until RACE reclaims that level, the broader trend remains technically compromised. The daily regime is neutral — not bearish, but not yet in a confirmed uptrend.
Momentum Indicators Signal Accumulation
The daily RSI reads 54.28 — modestly above the midpoint. This reflects recovering momentum without any overbought risk. There is room for further upside from a momentum perspective. Meanwhile, the daily MACD tells a more encouraging story. The MACD line at $4.26 sits clearly above the signal line at $2.47, with a positive histogram of $1.78. That positive crossover implies accumulation pressure is building beneath the surface.
The Bollinger Bands on the daily frame are well-spaced. The midline sits at $344.27 and the upper band at $366.54. RACE is trading in the upper half of the band — another constructive sign. The daily ATR of $11.65 confirms notable daily volatility. Traders should size accordingly.
Pivot Points and Volatility Context
Daily pivot analysis puts the pivot point at $356.26. RACE closed just below that level at $354.91. The R1 resistance sits at $359.53, while S1 support rests at $351.64. Holding above $351.64 on any pullback would preserve the short-term bullish structure. A sustained move above $356.26 would re-establish the daily pivot as a floor rather than a ceiling.
Hourly Momentum Cools, but the Trend Holds
The hourly chart shows softening momentum, yet RACE’s intermediate uptrend structure remains intact above the 1H EMA200.
On the 1H chart, the picture becomes more nuanced. RACE is trading at $354.97 — just below its 1H EMA20 of $355.68. That slight undercut is a short-term caution flag. The 1H EMA50 at $353.21 continues to provide dynamic support. Price remains well above the 1H EMA200 at $346.92, confirming the intermediate uptrend structure.
In contrast, the 1H MACD has turned slightly negative. The histogram reads -0.52, with the MACD line at $0.76 now below the signal at $1.28. That divergence from the bullish daily MACD reading is worth noting. It suggests short-term momentum has softened — not reversed, but paused. This is a classic setup where daily conviction exists, but hourly execution requires patience.
The 1H RSI at 49.64 is essentially neutral — right at the midpoint. There is no directional edge from momentum alone at this level. The 1H Bollinger Bands show price trading below the midline at $355.25. That is another subtle sign that near-term energy has faded. Hourly ATR of $4.23 suggests individual candles still carry enough range for meaningful intraday swings.
15-Minute Compression Hints at an Impending Move
The 15-minute chart shows a tightening consolidation. Bollinger Band compression signals that the next directional move may be approaching soon.
The 15-minute timeframe shows RACE in a tight consolidation. The Bollinger Bands have compressed sharply — upper at $355.98, lower at $354.49 — indicating a squeeze is forming. Historically, Bollinger Band squeezes of this nature precede directional moves. The 15m MACD, while still slightly negative, shows its histogram turning upward at $0.03. This hints at an early stabilization attempt.
The 15m RSI at 44.88 leans slightly bearish in the short term. Overall, the 15-minute picture is one of indecision. Compression could resolve in either direction. The 15m pivot at $354.88 is essentially where price is sitting. A sustained hold above the 15m R1 at $355.48 would signal that near-term buyers are gaining control.
The Bullish Scenario After Morgan Stanley’s Upgrade
If the Morgan Stanley upgrade catalyzes institutional buying, RACE has a clear technical pathway toward the 200-day EMA at $374.01. Reclaiming that level would mark a genuine trend reversal.
The stock needs to reclaim the daily pivot at $356.26 and push through R1 at $359.53. Beyond that, the upper Bollinger Band at $366.54 is the next logical target. A break above $366.54 would put the long-term EMA200 resistance at $374.01 squarely in focus. Reclaiming that level would confirm a genuine trend reversal on the daily chart.
Supporting this case: the daily MACD remains positively configured. Both short-term EMAs are rising. RSI has room to climb toward overbought territory before signaling any exhaustion. A broader market tailwind would accelerate this scenario.
The Bearish Case: When the Upgrade Fails to Deliver
If RACE cannot hold above S1 support at $351.64, the bullish narrative would weaken materially. A slide toward the 50-day EMA would then become the more likely path.
The failed push toward $360.88 intraday — paired with a close near session lows — cannot be dismissed. If RACE breaks below the S1 support at $351.64 and loses the 20-day EMA at $347.61, the bullish narrative weakens materially. A slide toward the 50-day EMA at $345.55 would likely follow. Below that, the mid-Bollinger Band at $344.27 offers the next meaningful support. A breakdown through those levels would suggest the Morgan Stanley upgrade failed to generate sustainable demand. That would be a bearish signal in itself.
The cooling 1H MACD and neutral RSI across timeframes mean bears do not need much to keep the stock in check. If the broader market weakens, RACE’s $11.65 daily ATR means drawdowns can be swift and painful.
Positioning Around RACE’s Inflection Point
RACE is at a credible inflection point where the Morgan Stanley upgrade provides a fundamental catalyst. However, execution timing and risk discipline remain essential.
The fundamental catalyst — Morgan Stanley’s upgrade of Ferrari stock — provides a reasonable narrative for a move higher. The technical setup on the daily chart is constructive but not decisive. Momentum is positive. Structure is improving. Yet the 200-day EMA resistance at $374 remains a formidable barrier.
Therefore, the risk-reward balance hinges on execution timing. Bulls want to see RACE absorb the intraday weakness and reclaim $356 on a closing basis. Bears are watching the $351.64 support level closely. With volatility running at $11.65 daily ATR and the 15-minute chart compressing into a squeeze, the next directional move is unlikely to be subtle. Approach with discipline and defined risk levels.
FAQ
What does Morgan Stanley’s upgrade mean for Ferrari stock?
The Morgan Stanley upgrade provides a fundamental catalyst that tilts the narrative bullish for RACE. However, the stock still faces technical resistance at the 200-day EMA of $374.01. An upgrade alone does not guarantee an immediate breakout. Price action confirmation remains essential before any directional commitment.
What are the key support and resistance levels for RACE?
Key resistance levels include the daily pivot at $356.26, R1 at $359.53, the upper Bollinger Band at $366.54, and the 200-day EMA at $374.01. Key support levels are S1 at $351.64, the 20-day EMA at $347.61, and the 50-day EMA at $345.55.
Is RACE’s technical setup bullish or bearish right now?
The daily setup is cautiously constructive. RACE trades above its 20-day and 50-day EMAs with a positive MACD crossover. However, it remains below the 200-day EMA, and hourly momentum has cooled. The overall regime is neutral — constructive but not yet confirmed as a full uptrend.
What would confirm a genuine trend reversal for RACE?
A sustained break and close above the 200-day EMA at $374.01 would confirm a genuine trend reversal on the daily chart. Until that level is reclaimed, the long-term trend remains technically compromised despite the improving short-term structure and the Morgan Stanley upgrade catalyst.
Disclaimer: This article is for informational purposes only and does not constitute financial advice, an investment recommendation, or a solicitation to buy or sell any financial instrument or cryptocurrency. The analysis provided is not indicative of future results. Investing in crypto assets and financial markets carries a high risk of capital loss. Always do your own research (DYOR) and consult a qualified financial advisor before making any decision.
Article produced with the assistance of artificial intelligence and reviewed by the editorial team.


You May Also Like

BOXABL Expands into UK and Ireland Through Distribution Agreement with TerraCaita
Altseason Outlook Begins to Build on Strong Support From ALTSZN in Rotation

How America can stage a 'remarkable comeback' after Trump’s 'bread and circuses'


