

MSTR stock strategy: will the rebound hold? Below $118 there’s a risk of -15%

The stock strategy on MSTR is facing a technical crossroads: an intraday rebound is trying to legitimize itself, while the daily picture confirms a bearish structure. The Strategy stock (NASDAQ: MSTR) is trading at around $123.97, after a volatile session with a high at 128.6 and a low at 117.27. The rebound is visible. It remains to be seen whether it has the strength to change anything structural.
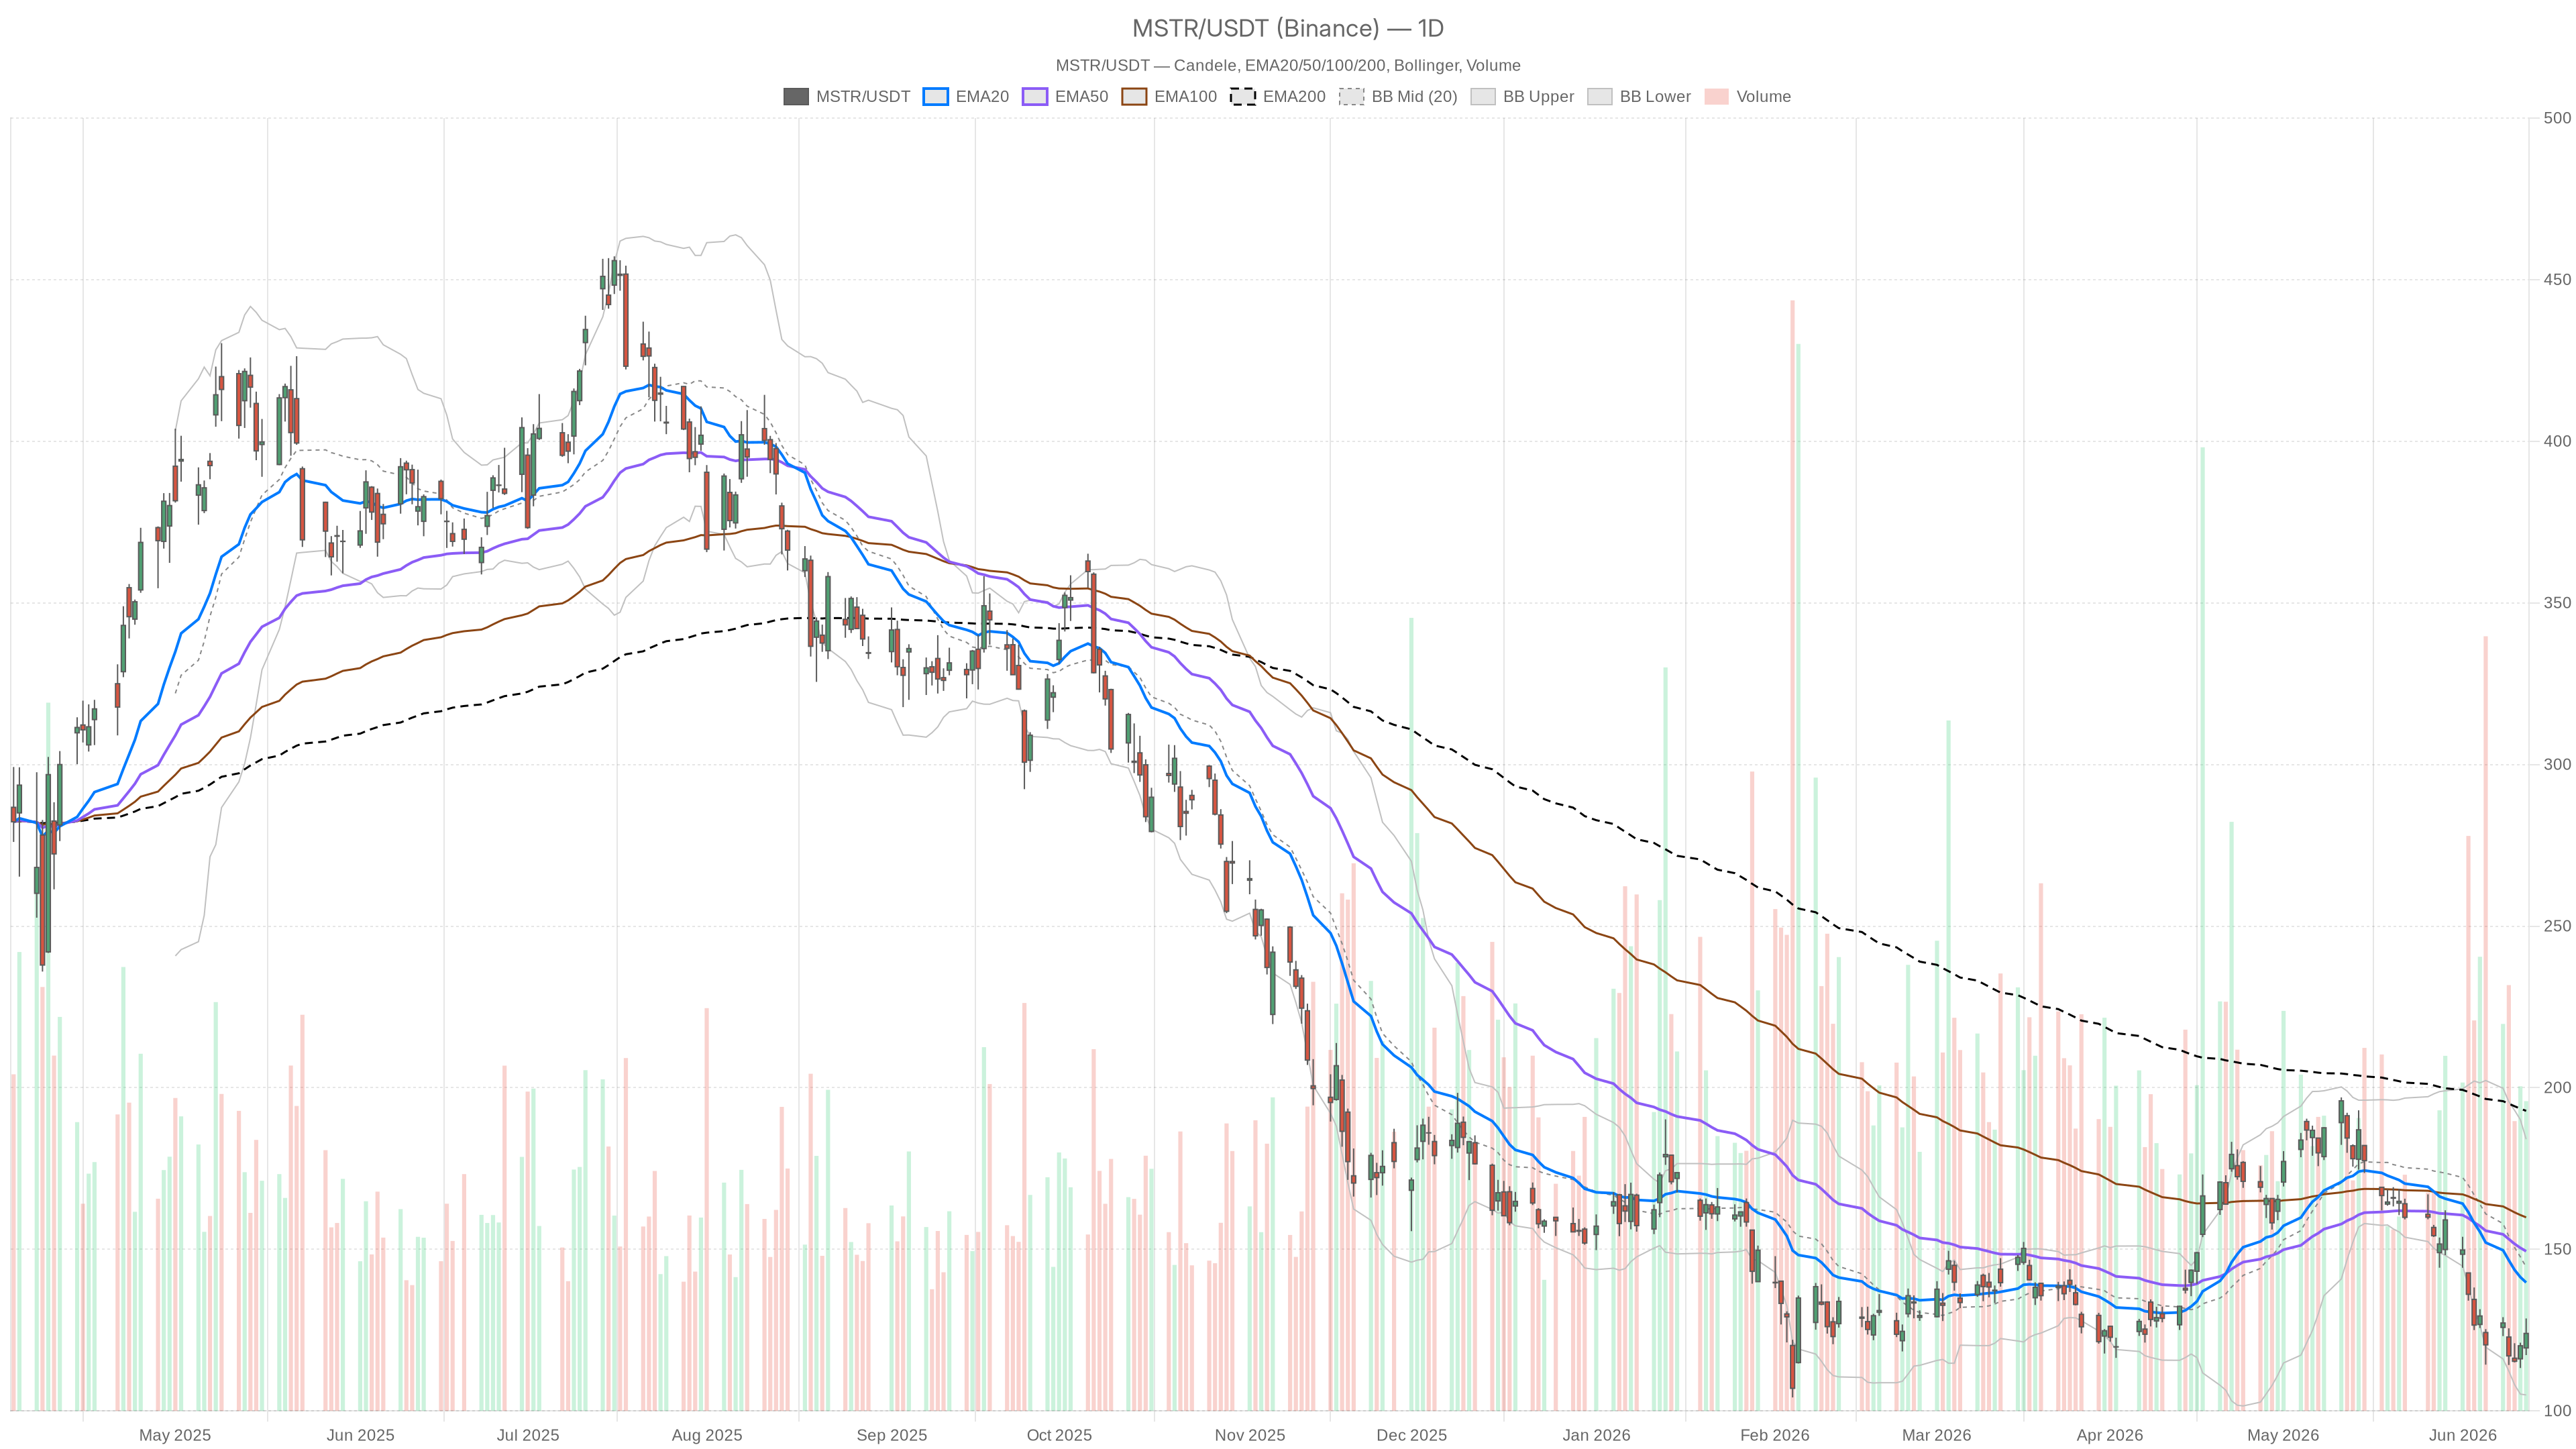 MSTR — daily chart with candles, EMA20/EMA50 and volumes.
Key points
- Bearish daily trend: price below EMA20 (139.72), EMA50 (149.4) and EMA200 (192.82)
- Daily RSI at 37.22: selling pressure is dominant but close to a possible exhaustion
- Immediate resistance at 124.20–124.57 where pivot R1, 15m Bollinger middle band and hourly EMA50 converge
- Critical support at 117.96 (daily S1): a break opens room towards 104.93
- On the hourly timeframe a bullish MACD crossover is underway, but upside space is already limited
The daily confirms the bearish pressure
On the daily chart the bearish trend is fully confirmed by the price being positioned below all the main moving averages. The stock is clearly below the EMA20 at 139.72, the EMA50 at 149.4 and the EMA200 at 192.82. These are three dynamic levels acting as resistance, about 15, 25 and 70 points away from the current price. This alignment — price pressed below all the moving averages in sequence — is the technical signature of a mature bearish trend.
The daily RSI at 37.22 carries specific weight in reading the current phase. It is not yet in extreme oversold territory, but it is approaching the critical area below 35. Historically that zone precedes either accelerations to the downside or violent technical rebounds. At the current value, selling pressure remains dominant, but it is starting to show signs of possible exhaustion.
On the daily MACD front the picture is equally heavy: line at -12.45, signal at -9.39 and histogram at -3.06. The negative and expanding histogram indicates that the divergence between the two components is growing to the detriment of buyers. On the daily there is no sign of reversal: the bearish momentum is active and consolidated.
Bollinger Bands and pivots: the positioning of the stock
MSTR is moving in the lower half of the daily Bollinger channel, with technical room still available to the downside. The lower band is at 104.93, the upper band at 184.07 and the middle at 144.5. The price at 123.97 is far from the lower band: there is still room before reaching a statistically significant extension. This is not a stock in extreme oversold relative to the bands.
The pivot levels offer a more operational reading for the short term. The daily pivot point is at 123.28, very close to the current price. Resistance R1 is at 129.29 and support S1 at 117.96. This results in a very tight reference zone: those buying near the pivot are exposed to a downside risk towards S1 of about six points, with a first upside target at 129.29. The daily ATR at 10.63 confirms high volatility: each session can move the stock by almost eleven dollars on average.
The hourly timeframe lights up a recovery signal
On the hourly timeframe momentum has improved in recent hours, with a bullish MACD crossover in the making. The price at 123.96 is above the hourly EMA20 at 121.27 — a first positive signal. However, it remains below the EMA50 at 124.57 and far from the EMA200 at 145.17, a structural obstacle even on this time horizon.
The hourly RSI at 57.33 is the most encouraging data point in the whole picture. It is in neutral-positive territory, far from oversold, indicating that buying pressure in recent hours has had substance. The hourly MACD also confirms this: positive line at 0.66, signal at -0.32 and histogram at 0.98. The bullish crossover is underway and momentum is building.
The Bollinger Bands on the hourly chart show the price near the upper band at 126.66, with the middle at 119.61. This positioning indicates that the rebound has already used up much of the available upside space in the short term. A further acceleration would require an expansion of the band, i.e. an increase in directional bullish volatility.
The 15-minute chart tempers enthusiasm about the rebound
The first signs of exhaustion of the intraday rebound come from the 15-minute timeframe. The MACD shows a slightly negative histogram at -0.26, after the line (0.71) started to move below the signal (0.97). This is the classic sign of deteriorating momentum after a bullish push.
The price is at 123.96, just below the 15-minute Bollinger middle band at 124.21 and very close to the pivot resistance R1 at 124.22. This convergence between the Bollinger middle band and the pivot resistance creates a natural technical rejection zone around 124.20–124.57. Here the pivot R1, the 15-minute Bollinger middle band and the hourly EMA50 overlap. The RSI at 56.04 is not overbought, but the MACD signal suggests that the pace of the rise is slowing precisely on this technical cluster.
For the short-term stock strategy, any long entry must reckon with a composite resistance that is hard to ignore.
Bullish scenario: the steps needed for a reversal
A credible reversal of the bearish structure requires a break of 129.29 with a daily close accompanied by above-average volumes. It is not enough to approach that level: a decisive breakout is needed to turn R1 from resistance into support.
The next step is to reclaim the daily EMA20 at 139.72. As long as the price remains below this average, any rebound must be classified as a corrective move within a primary bearish trend. On the indicators front, a daily RSI rising above 45 and a MACD starting to reduce the negative gap on the histogram would be needed.
The fundamental context offers some supporting elements: Strategy Inc. continues to accumulate Bitcoin, market sentiment has improved thanks to positive geopolitical news and options flows indicate bullish speculative interest. However, without technical confirmation on key levels, these elements remain background factors and not certain catalysts.
Bearish scenario: the threshold that must not give way
The bearish scenario gains strength if the stock loses the daily S1 support at 117.96. A close below that level would open room towards the lower daily Bollinger band, currently at 104.93. This would be a drop of about 15% from the current price.
In terms of momentum, a daily RSI below 30 with a MACD in further negative expansion would represent the most worrying technical signal. In that context, even hourly rebounds would lose structural significance, becoming mere selling opportunities for those managing short positions.
The nature of the stock amplifies these risks. MSTR is structurally exposed to Bitcoin: a weakening of the crypto market would be transmitted immediately to the price, accelerating any bearish move already present in the technical structure.
The tension between timeframes: what to watch now
MSTR is experiencing an unresolved tension between a hostile daily chart and an hourly chart in technical recovery. The daily is clear: bearish trend, deteriorated structure, no confirmed reversal signal. The hourly shows an attempt at recovery with positive momentum, but already close to technical limits. The 15-minute chart shows the first signs of exhaustion of the rebound.
Two levels are attracting traders’ attention at the moment. On the resistance side, the 124.20–124.57 area is the first concrete obstacle, where pivots, moving averages and Bollinger Bands overlap. Higher up, 129.29 remains the discriminating level: breaking above it would change short-term sentiment, even without altering the main trend. On the support side, 117.96 is the threshold that must not give way. If it did, the strategy for buyers would become much more defensive, with the risk of a new leg down towards the 110–105 area.
The current uncertainty is real and legitimate. The intraday rebound has technical foundations on the hourly chart, but it is not yet strong enough to call the daily picture into question. Anyone trading MSTR at this time must clearly choose their reference timeframe, because the signals from the different time horizons do not tell the same story.
FAQ
What is the most important level to monitor on MSTR?
The discriminating level is 129.29 (daily R1 resistance) on the bullish side and 117.96 (daily S1 support) on the bearish side. A close above 129.29 would change short-term sentiment; a break below 117.96 would open room towards 104.93. In the very short term, the 124.20–124.57 area is the first concrete technical obstacle.
Can the current rebound be considered a trend reversal?
No. The rebound has technical foundations on the hourly timeframe — with a bullish MACD crossover and RSI at 57.33 — but the daily picture remains fully bearish. The price is below all the main moving averages and the daily MACD is in negative expansion. As long as MSTR does not at least reclaim the daily EMA20 at 139.72, any rebound is classified as a corrective move within the bearish trend.
Why is MSTR so sensitive to Bitcoin’s performance?
Strategy Inc. holds a significant amount of Bitcoin on its balance sheet, making the stock structurally exposed to the crypto market. A weakening of Bitcoin is transmitted directly to MSTR’s price, amplifying the bearish moves already present in the technical structure. The daily ATR at 10.63 confirms this high volatility that characterizes the stock.
{“@context”:”https://schema.org”,”@type”:”FAQPage”,”mainEntity”:[{“@type”:”Question”,”name”:”What is the most important level to monitor on MSTR?”,”acceptedAnswer”:{“@type”:”Answer”,”text”:”The discriminating level is 129.29 (daily R1 resistance) on the bullish side and 117.96 (daily S1 support) on the bearish side. A close above 129.29 would change short-term sentiment; a break below 117.96 would open room towards 104.93. In the very short term, the 124.20–124.57 area is the first concrete technical obstacle.”}},{“@type”:”Question”,”name”:”Can the current rebound be considered a trend reversal?”,”acceptedAnswer”:{“@type”:”Answer”,”text”:”No. The rebound has technical foundations on the hourly timeframe — with a bullish MACD crossover and RSI at 57.33 — but the daily picture remains fully bearish. The price is below all the main moving averages and the daily MACD is in negative expansion. As long as MSTR does not at least reclaim the daily EMA20 at 139.72, any rebound is classified as a corrective move within the bearish trend.”}},{“@type”:”Question”,”name”:”Why is MSTR so sensitive to Bitcoin’s performance?”,”acceptedAnswer”:{“@type”:”Answer”,”text”:”Strategy Inc. holds a significant amount of Bitcoin on its balance sheet, making the stock structurally exposed to the crypto market. A weakening of Bitcoin is transmitted directly to MSTR’s price, amplifying the bearish moves already present in the technical structure. The daily ATR at 10.63 confirms this high volatility that characterizes the stock.”}}]}
Disclaimer: This article is for informational purposes only and does not constitute financial advice, investment recommendation or a solicitation to buy or sell financial instruments or cryptocurrencies. The analyses do not guarantee future results. Investments in crypto-assets and financial markets involve a high risk of capital loss. Always do your own research (DYOR) and consult a qualified financial advisor before making any decision.
Content created with the assistance of artificial intelligence and human editorial review.


You May Also Like

Vitalik Buterin Proposes Self-Sovereign AI Stack To Protect Users From Risks Of AI Agents

Standard Chartered Sees Tokenization Driving DeFi Toward $2.7 Trillion by 203

MediaTek’s AI Pivot and Google’s Samsung Partnership: Inside the TSMC Capacity Squeeze


