

Advanced Micro Devices Stock Surges Past $511—but 10% Dilution Looms

Advanced Micro Devices stock is trading in firmly bullish territory after a landmark Meta AI deal and a Citi upgrade pushed AMD above its moving average stack. The stock closed at $511.57 on June 12, touching an intraday high of $521.71.
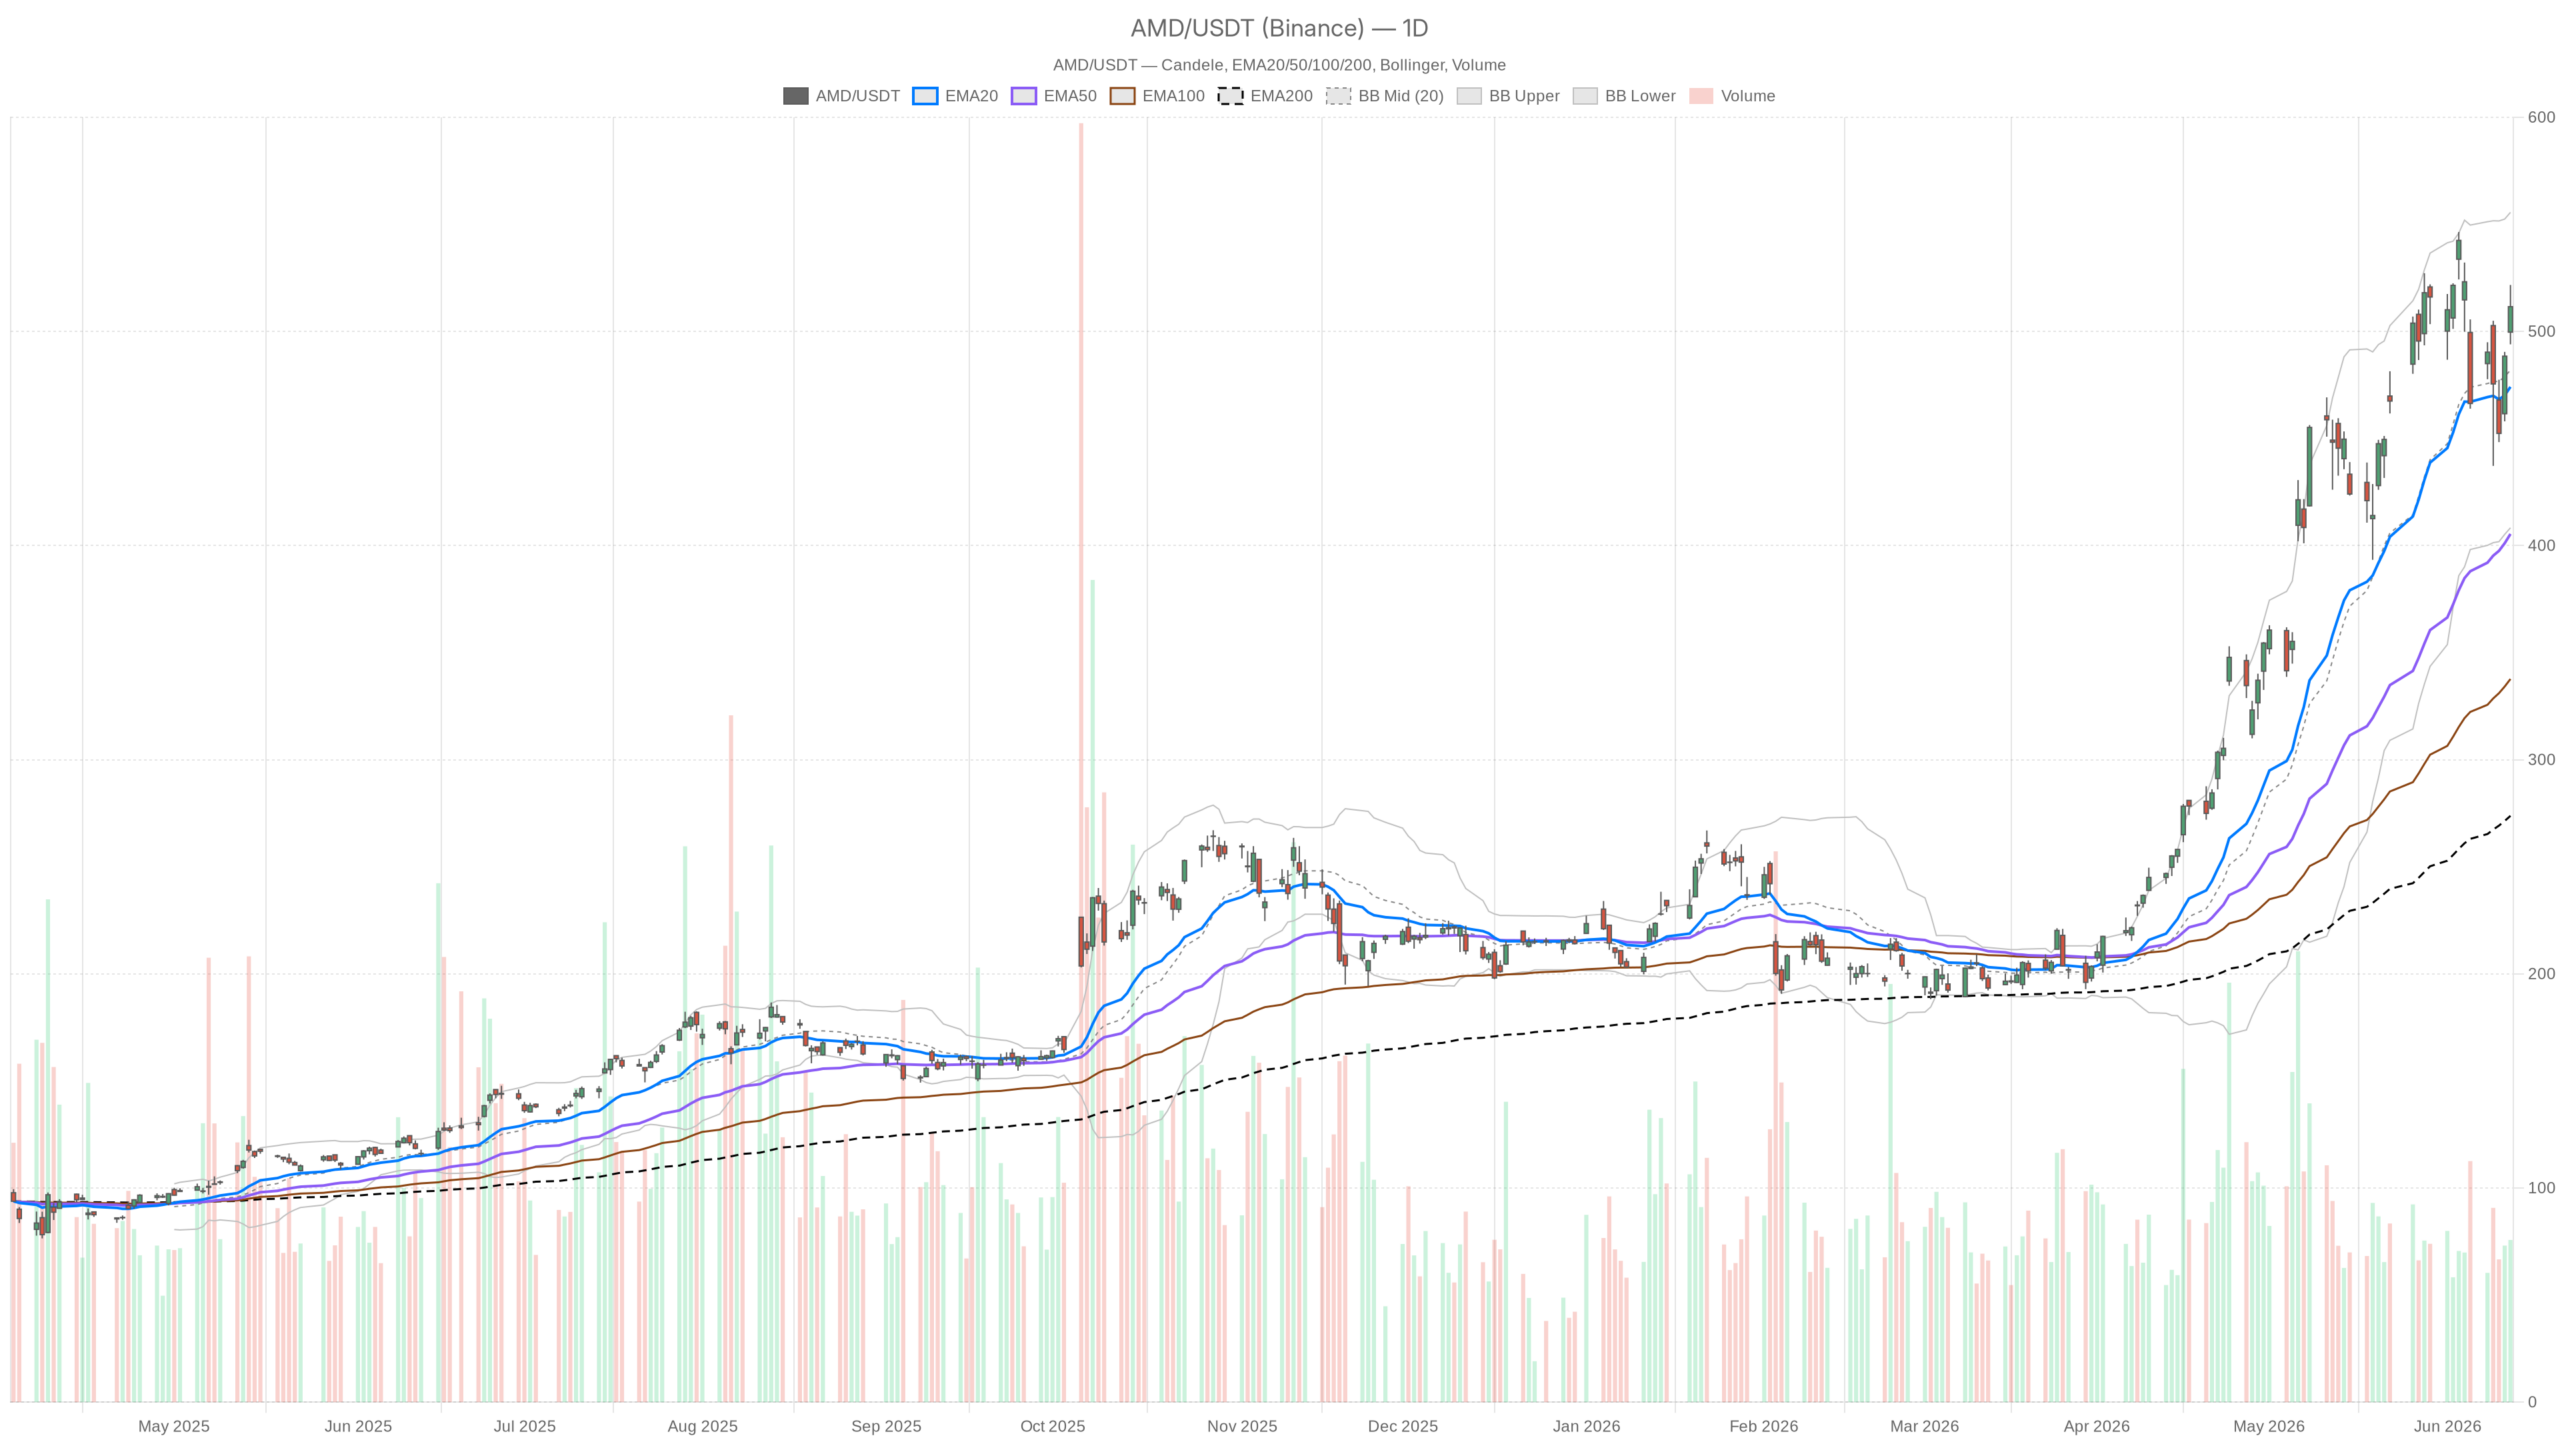 AMD — daily chart with candlesticks, EMA20/EMA50 and volume.
Key takeaways
- AMD closed at $511.57 on June 12 after touching an intraday high of $521.71, with a daily ATR of $35.06 signaling high volatility.
- Citi upgraded AMD to Buy from Neutral, raising the price target to $575 and citing unrecognized AI chip potential.
- AMD announced its largest AI chip deal to date with Meta Platforms, covering a multi-year 6-gigawatt Instinct GPU rollout.
- The daily EMA stack shows price well above the EMA20 ($474), EMA50 ($405), and EMA200 ($273), confirming a multi-month uptrend.
- The Meta warrant structure introduces roughly 10% dilution risk for existing shareholders, tied to shipment milestones.
Daily EMA Stack Reinforces the Bullish Trend for Advanced Micro Devices Stock
Advanced Micro Devices stock sits comfortably above all three key daily EMAs, confirming a sustained multi-month uptrend rather than a short-term bounce. Price at $511.57 holds well above the EMA20 at $474.13, the EMA50 at $405.44, and the EMA200 at $273.81. That broad separation across all three averages signals trend strength, not a temporary spike.
Notably, AMD has essentially doubled off its longer-term EMA200 baseline. This reflects the scale of repricing driven by the AI data center narrative. The distance from the EMA200 leaves little room for ambiguity about the trend’s durability.
Momentum and Volatility Indicators Paint a Constructive Picture
Momentum readings across key indicators support the bullish case for Advanced Micro Devices stock. However, the daily MACD shows signs of cooling momentum that warrant attention.
RSI and MACD Signal Mid-Trend Strength
Daily RSI at 60.45 sits firmly in bullish territory without triggering overbought warnings. This reading typically appears mid-trend rather than at exhaustion peaks. However, the daily MACD tells a more nuanced story. The MACD line at 28.51 remains below the signal line at 36.68, producing a negative histogram of -8.16.
This divergence does not reverse the bullish bias. Still, it suggests the immediate momentum impulse has moderated. Price is strong, but the underlying rate of acceleration is cooling.
Bollinger Bands and Pivot Points Define Key Levels
The daily Bollinger Bands reinforce the constructive setup. With the midband at $481.97 and the upper band at $555.63, AMD has room to run before encountering statistical resistance. Daily ATR of $35.06 confirms high volatility. Intraday swings of that magnitude are routine and traders should calibrate risk accordingly.
Meanwhile, pivot analysis adds useful near-term context. The pivot sits at $509.09, with R1 at $524.19 and S1 at $496.48. AMD closed just above the pivot and within range of R1. Clearing $524 with volume would be a constructive sign. S1 near $496 also aligns closely with the EMA20, forming a meaningful support cluster on any pullback.
Intraday Timeframes Confirm the Bullish Structure
Shorter timeframes for Advanced Micro Devices stock reinforce the daily bullish picture. The 1-hour chart shows active buying pressure, while the 15-minute chart offers tactical execution context for active traders.
1-Hour Chart Shows Active Buying
The hourly chart confirms the trend. Price holds above the H1 EMA20 at $493.34, EMA50 at $489.17, and EMA200 at $453.28. At the same time, the H1 MACD sits in positive territory, with the line at 10.24 above the signal at 5.28. A histogram reading of 4.96 confirms active buying pressure within the trend. H1 RSI at 63.05 mirrors the daily reading, elevated but not stretched.
15-Minute Chart Offers Tactical Nuance
On the 15-minute chart, the picture softens slightly at the margin. Price closed at $511.12, right at the session low, and the MACD histogram turned negative at -2.00. The 15m RSI sits neutral at 55.01, offering no directional signal.
However, this short-term softness does not undermine the larger trend. It simply suggests immediate tick-by-tick momentum faded heading into the close. The structure favors dip-buyers, but the intraday setup lacks urgency.
Fundamental Catalysts Power the Rally in Advanced Micro Devices Stock
Advanced Micro Devices stock is riding two powerful catalysts: a Citi upgrade to Buy and a landmark AI chip agreement with Meta Platforms. Together, they represent AMD’s most significant fundamental shift in the AI era.
Citi analyst Atif Malik upgraded AMD to Buy from Neutral on June 12. He raised the price target from $460 to $575. His core argument, that the market has not fully priced AMD as a legitimate second-source AI chip supplier, aligns directly with the technical breakout. Meanwhile, the Meta Platforms agreement covers a multi-year 6-gigawatt Instinct GPU rollout, AMD’s largest AI chip deal to date.
Notably, the deal includes up to 160 million share warrants for Meta, tied to shipment milestones. That warrant structure introduces roughly 10% dilution risk for existing shareholders. This factor deserves monitoring as the agreement progresses.
Bullish and Bearish Scenarios for Advanced Micro Devices Stock
The base case for Advanced Micro Devices stock remains bullish above $509. A break below $496, in contrast, would raise concerns about a deeper pullback driven by the MACD divergence.
Bullish Scenario
The bullish case rests on AMD sustaining above the $509 pivot and extending toward $524 R1. A clean break above that zone, ideally on volume, opens a path toward the upper Bollinger band near $555. That level also aligns with Citi’s revised $575 target.
The Meta deal anchors AMD’s Instinct GPU business with multi-year demand. Meanwhile, the Citi upgrade signals that institutional re-rating remains in early stages. As long as the EMA structure holds and the MACD crossover stays shallow, the upside bias remains intact.
Bearish Scenario
The bearish case centers on the daily MACD divergence deepening. If the histogram widens further to the downside, it would indicate price strength is masking deteriorating momentum. That is a classic setup for a mean-reversion pullback.
A close below $496 S1 would weaken the near-term structure. A deeper break below EMA20 near $474 would signal a serious trend interruption. Additionally, the Meta warrant dilution could weigh on sentiment if investors begin pricing the 10% dilution risk more aggressively.
Overall Outlook
Advanced Micro Devices stock sits in a high-conviction bullish regime across daily and hourly timeframes. Short-term consolidation provides a natural reset rather than a reversal signal. The combination of a landmark AI supply agreement, a fresh institutional upgrade with a $575 target, and a clean EMA stack creates a well-supported structural case.
Nevertheless, the daily MACD moderation and the Meta warrant dilution mechanics remain real variables. They prevent this from being a one-way trade. Volatility, as the $35 daily ATR makes clear, remains high, and that cuts both ways.
FAQ
What is driving Advanced Micro Devices stock higher?
AMD is rallying on two powerful catalysts: a Citi upgrade to Buy with a $575 price target and a landmark AI chip deal with Meta Platforms. The Meta agreement, covering a multi-year 6-gigawatt Instinct GPU rollout, represents AMD’s largest AI chip deal to date.
What are the key technical levels to watch for AMD?
The pivot at $509.09 and R1 at $524.19 are the immediate levels to monitor. Support sits at S1 ($496.48), which aligns closely with the EMA20 ($474.13). The upper Bollinger band near $555 represents the next major upside target.
What risks does Advanced Micro Devices stock face right now?
The daily MACD shows a bearish crossover with a negative histogram of -8.16, signaling weakening momentum. Separately, the Meta deal includes warrants that could dilute existing shareholders by roughly 10% as shipment milestones are met.
Is AMD stock overbought at current levels?
No. Daily RSI at 60.45 sits in bullish momentum territory without triggering overbought warnings. This reading suggests mid-trend strength rather than an exhaustion peak, leaving room for further upside.
Disclaimer: This article is for informational purposes only and does not constitute financial advice, an investment recommendation, or a solicitation to buy or sell any financial instrument or cryptocurrency. The analysis provided is not indicative of future results. Investing in crypto assets and financial markets carries a high risk of capital loss. Always do your own research (DYOR) and consult a qualified financial advisor before making any decision.
Article produced with the assistance of artificial intelligence and reviewed by the editorial team.


You May Also Like

FIFA World Cup 2026 Prize Money: How Much Will the Champions Earn?

Upcoming Crypto Listings: Important Updates Investors Should Watch

Which Country Has Won the Most FIFA World Cups? Complete World Cup Winners Ranking


