

SpaceX Stock Surged 20% at IPO — Now $165 Is the Key Battle

SpaceX stock’s historic IPO delivered a nearly 20% first-day surge for SPCX. The daily chart still reads bullish. However, intraday momentum is cooling rapidly. The gap between long-term strength and short-term hesitation creates a complex setup traders cannot ignore.
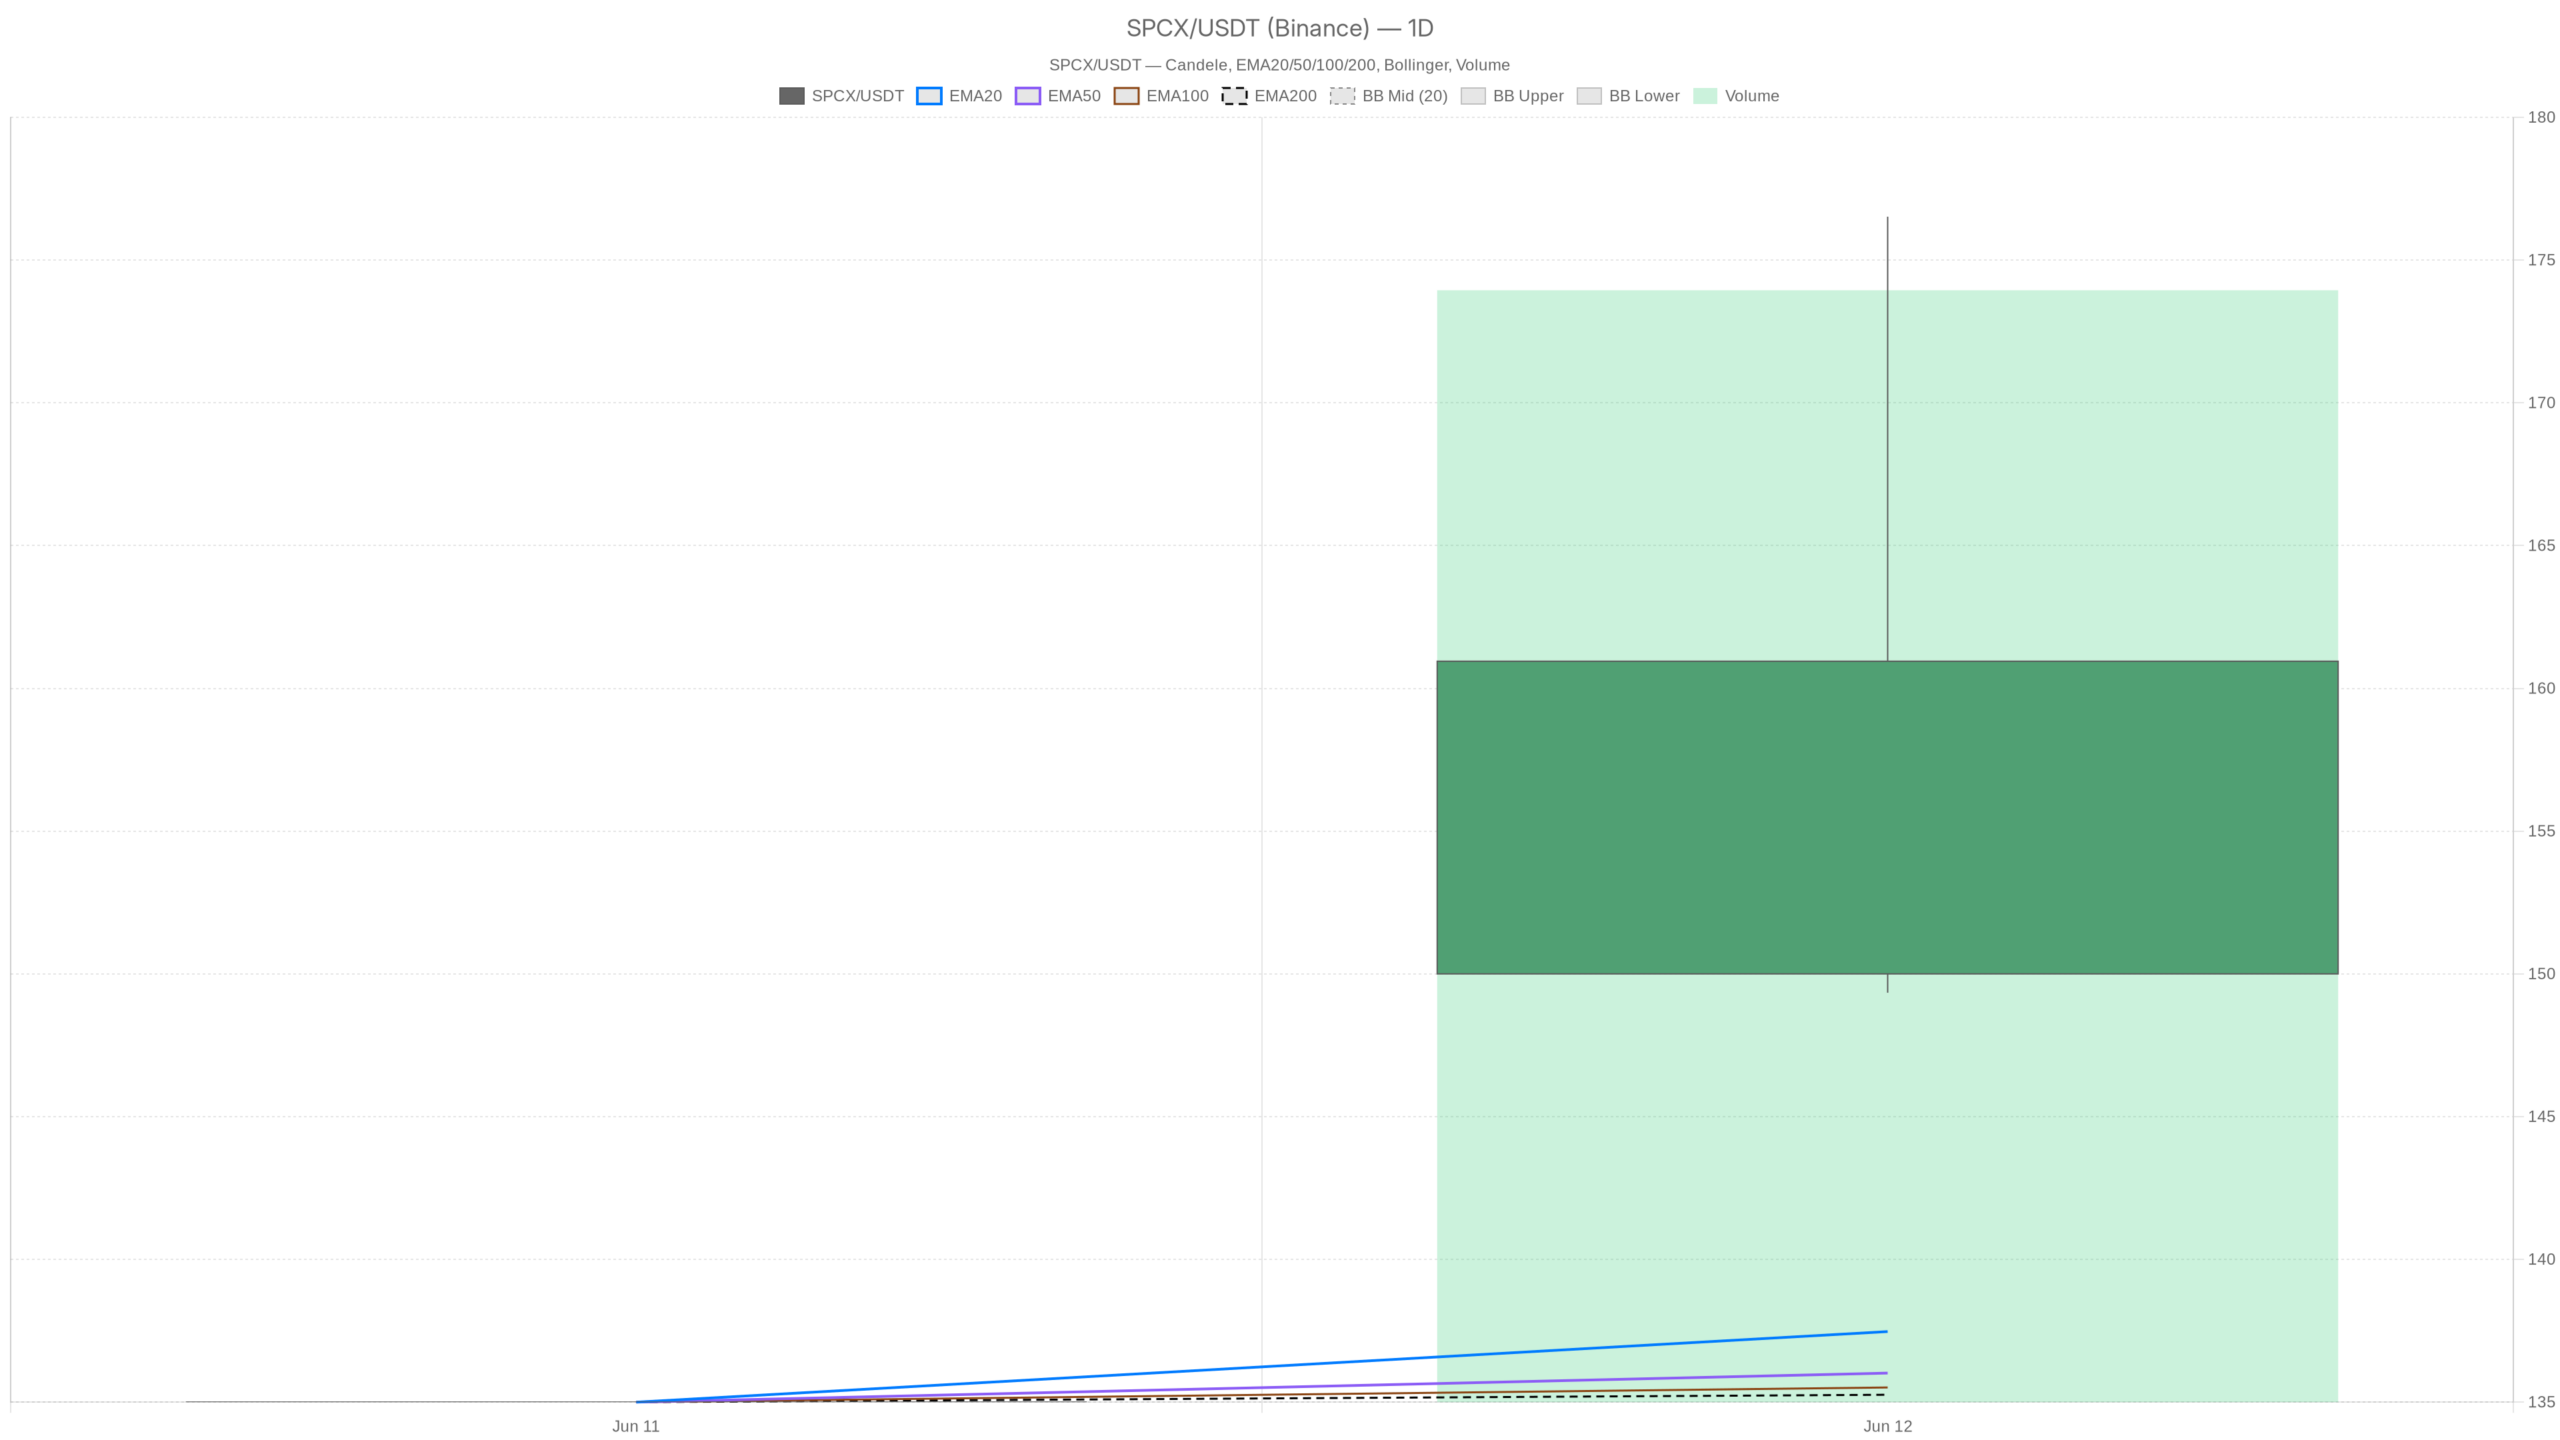 SPCX — daily chart with candlesticks, EMA20/EMA50 and volume.
Key takeaways
- SPCX closed at $160.95 on June 12, well above its EMA20 ($137.47), EMA50 ($136.02), and EMA200 ($135.26), confirming a strong daily bullish structure.
- The 1H chart shows price trading below all three EMAs clustered near $165, forming a near-term resistance ceiling.
- Short-term MACD readings have turned negative across both the hourly and 15-minute timeframes.
- The first earnings report, expected in late July or early August, is flagged as a critical near-term test for the stock.
- The daily pivot point sits at $162.27, with resistance at $175.20 and support at $148.02.
Daily Trend Remains Structurally Bullish
SPCX’s daily chart confirms a clear bullish trend. Price is trading significantly above all three key exponential moving averages.
SPCX closed at $160.95 on June 12. This places it well above the EMA20 at $137.47, the EMA50 at $136.02, and the EMA200 at $135.26. This stacked alignment confirms a strong trending regime. The daily MACD reinforces the picture. Its MACD line sits at 2.07, well above the signal line at 0.41, with a positive histogram of 1.66. Momentum is not just positive — it is building.
Post-IPO Volatility Within the Daily Session
The June 12th candle printed a high of $176.52 and a low of $149.34 — a range exceeding $27. That intraday swing reflects post-IPO price discovery that can be as dangerous as it is exciting. The daily pivot point sits at $162.27, with resistance at $175.20 and support at $148.02. Notably, SPCX closed below its own pivot point. This means the session ended in the lower half of its range, a subtle caution flag even within a bullish day.
Short-Term Momentum Points to Cooling
The intraday picture tells a markedly different story. SPCX at $161.27 is trading below all three hourly EMAs, and momentum indicators have turned negative.
Hourly Chart Flashes Bearish Signals
Price at $161.27 sits below the EMA20 at $165.16, the EMA50 at $165.10, and the EMA200 at $165.01. These three levels are tightly clustered near $165, forming a resistance ceiling. Reclaiming this zone is essential to restore short-term bullish momentum. The 1H MACD is in negative territory. Its MACD line reads -0.06, the signal sits at 0.20, and the histogram shows -0.26. This is a textbook bearish MACD crossover on the hourly chart. The 1H regime is classified as neutral, meaning the daily bullish thesis is not being confirmed intraday.
15-Minute Chart Mirrors the Caution
Similarly, the 15-minute chart reinforces the hourly caution. Price closed at $161.27. It sits again below the 15m EMA20 at $165.29, the EMA50 at $164.07, and the EMA200 at $162.23. The RSI14 stands at 47, just below the neutral midpoint of 50. That reading signals neither oversold nor overbought conditions — the market is in wait-and-see mode. Meanwhile, the 15m MACD histogram has deepened to -1.33, with the MACD line at -0.07 and the signal at 1.26. This divergence confirms that momentum has rolled over sharply in the short term. The ATR14 of $5.14 indicates volatility remains elevated. Any move in either direction is likely to carry real intraday distance.
Fundamental Catalysts Shape the Outlook
Elon Musk’s projection of $1 trillion in revenue by 2030 clearly energized early buyers. Yet the near-term path is less certain. Morningstar has flagged the first earnings report — expected in late July or early August — as a critical test for SpaceX stock. Meanwhile, the 19.2% single-day pop has already forced fresh debate about whether SPCX’s valuation adequately prices the risk alongside the ambition. SpaceX’s narrative spans satellite connectivity, space launch, and AI-adjacent businesses. This makes traditional valuation frameworks difficult to apply.
Bullish Scenario Hinges on Reclaiming $165
A decisive close above the $165 hourly EMA cluster would likely trigger short-term seller capitulation. The daily high of $176.52 would then become the logical next target. Daily pivot resistance at $175.20 would act as a key checkpoint. A supportive broader market, continued IPO enthusiasm, and positive pre-earnings commentary could all serve as catalysts. In that scenario, the daily bullish structure would be fully validated across all three timeframes.
Bearish Case Puts Support at $148 in Focus
The bearish case cannot be dismissed. Price currently sits below both its daily and hourly pivot points. The hourly EMAs are stacked against buyers, and short-term momentum indicators point lower. If selling pressure intensifies, the daily support level at $148.02 becomes the first meaningful floor. A close below that level would raise more serious questions about whether IPO euphoria has fully unwound. Moreover, a disappointing first earnings report — or even cautious guidance ahead of it — could trigger a sustained pullback from current levels.
FAQ
Is SPCX still bullish after its IPO surge?
The daily chart remains structurally bullish. SPCX closed at $160.95 on June 12, well above its EMA20, EMA50, and EMA200. The daily MACD is positive and building. However, the intraday picture has cooled, with short-term momentum turning negative on the hourly and 15-minute charts.
What price level must SPCX reclaim to resume its uptrend?
The critical level is the $165 cluster. The hourly EMA20, EMA50, and EMA200 are all tightly grouped near $165. A decisive close above this zone would restore short-term bullish momentum and likely open a path toward the daily high of $176.52.
What are the key risks for SpaceX stock in the near term?
The most immediate risk is the first earnings report, expected in late July or early August. A disappointing result or cautious guidance could trigger a pullback. Additionally, SPCX is trading below its daily pivot point of $162.27. A break below the $148.02 support would signal that IPO euphoria may be unwinding.
What support level matters most for SPCX right now?
The daily support at $148.02 is the first meaningful floor. A close below this level would raise serious questions about the sustainability of post-IPO gains and could lead to a deeper sell-off.
Disclaimer: This article is for informational purposes only and does not constitute financial advice, an investment recommendation, or a solicitation to buy or sell any financial instrument or cryptocurrency. The analysis provided is not indicative of future results. Investing in crypto assets and financial markets carries a high risk of capital loss. Always do your own research (DYOR) and consult a qualified financial advisor before making any decision.
Article produced with the assistance of artificial intelligence and reviewed by the editorial team.


You May Also Like

Vitalik Buterin Proposes Self-Sovereign AI Stack To Protect Users From Risks Of AI Agents

Standard Chartered Sees Tokenization Driving DeFi Toward $2.7 Trillion by 203

MediaTek’s AI Pivot and Google’s Samsung Partnership: Inside the TSMC Capacity Squeeze


