

Salesforce below all moving averages: will 3.6 billion for Fin save the shares?

Salesforce shares closed on June 15, 2026 at $164.55, below the daily pivot and squeezed by all the main moving averages. The structure is bearish on every timeframe. However, the announcement of the $3.6 billion acquisition of the AI platform Fin has interrupted a streak of nine negative sessions. Is this enough to reverse the trend?
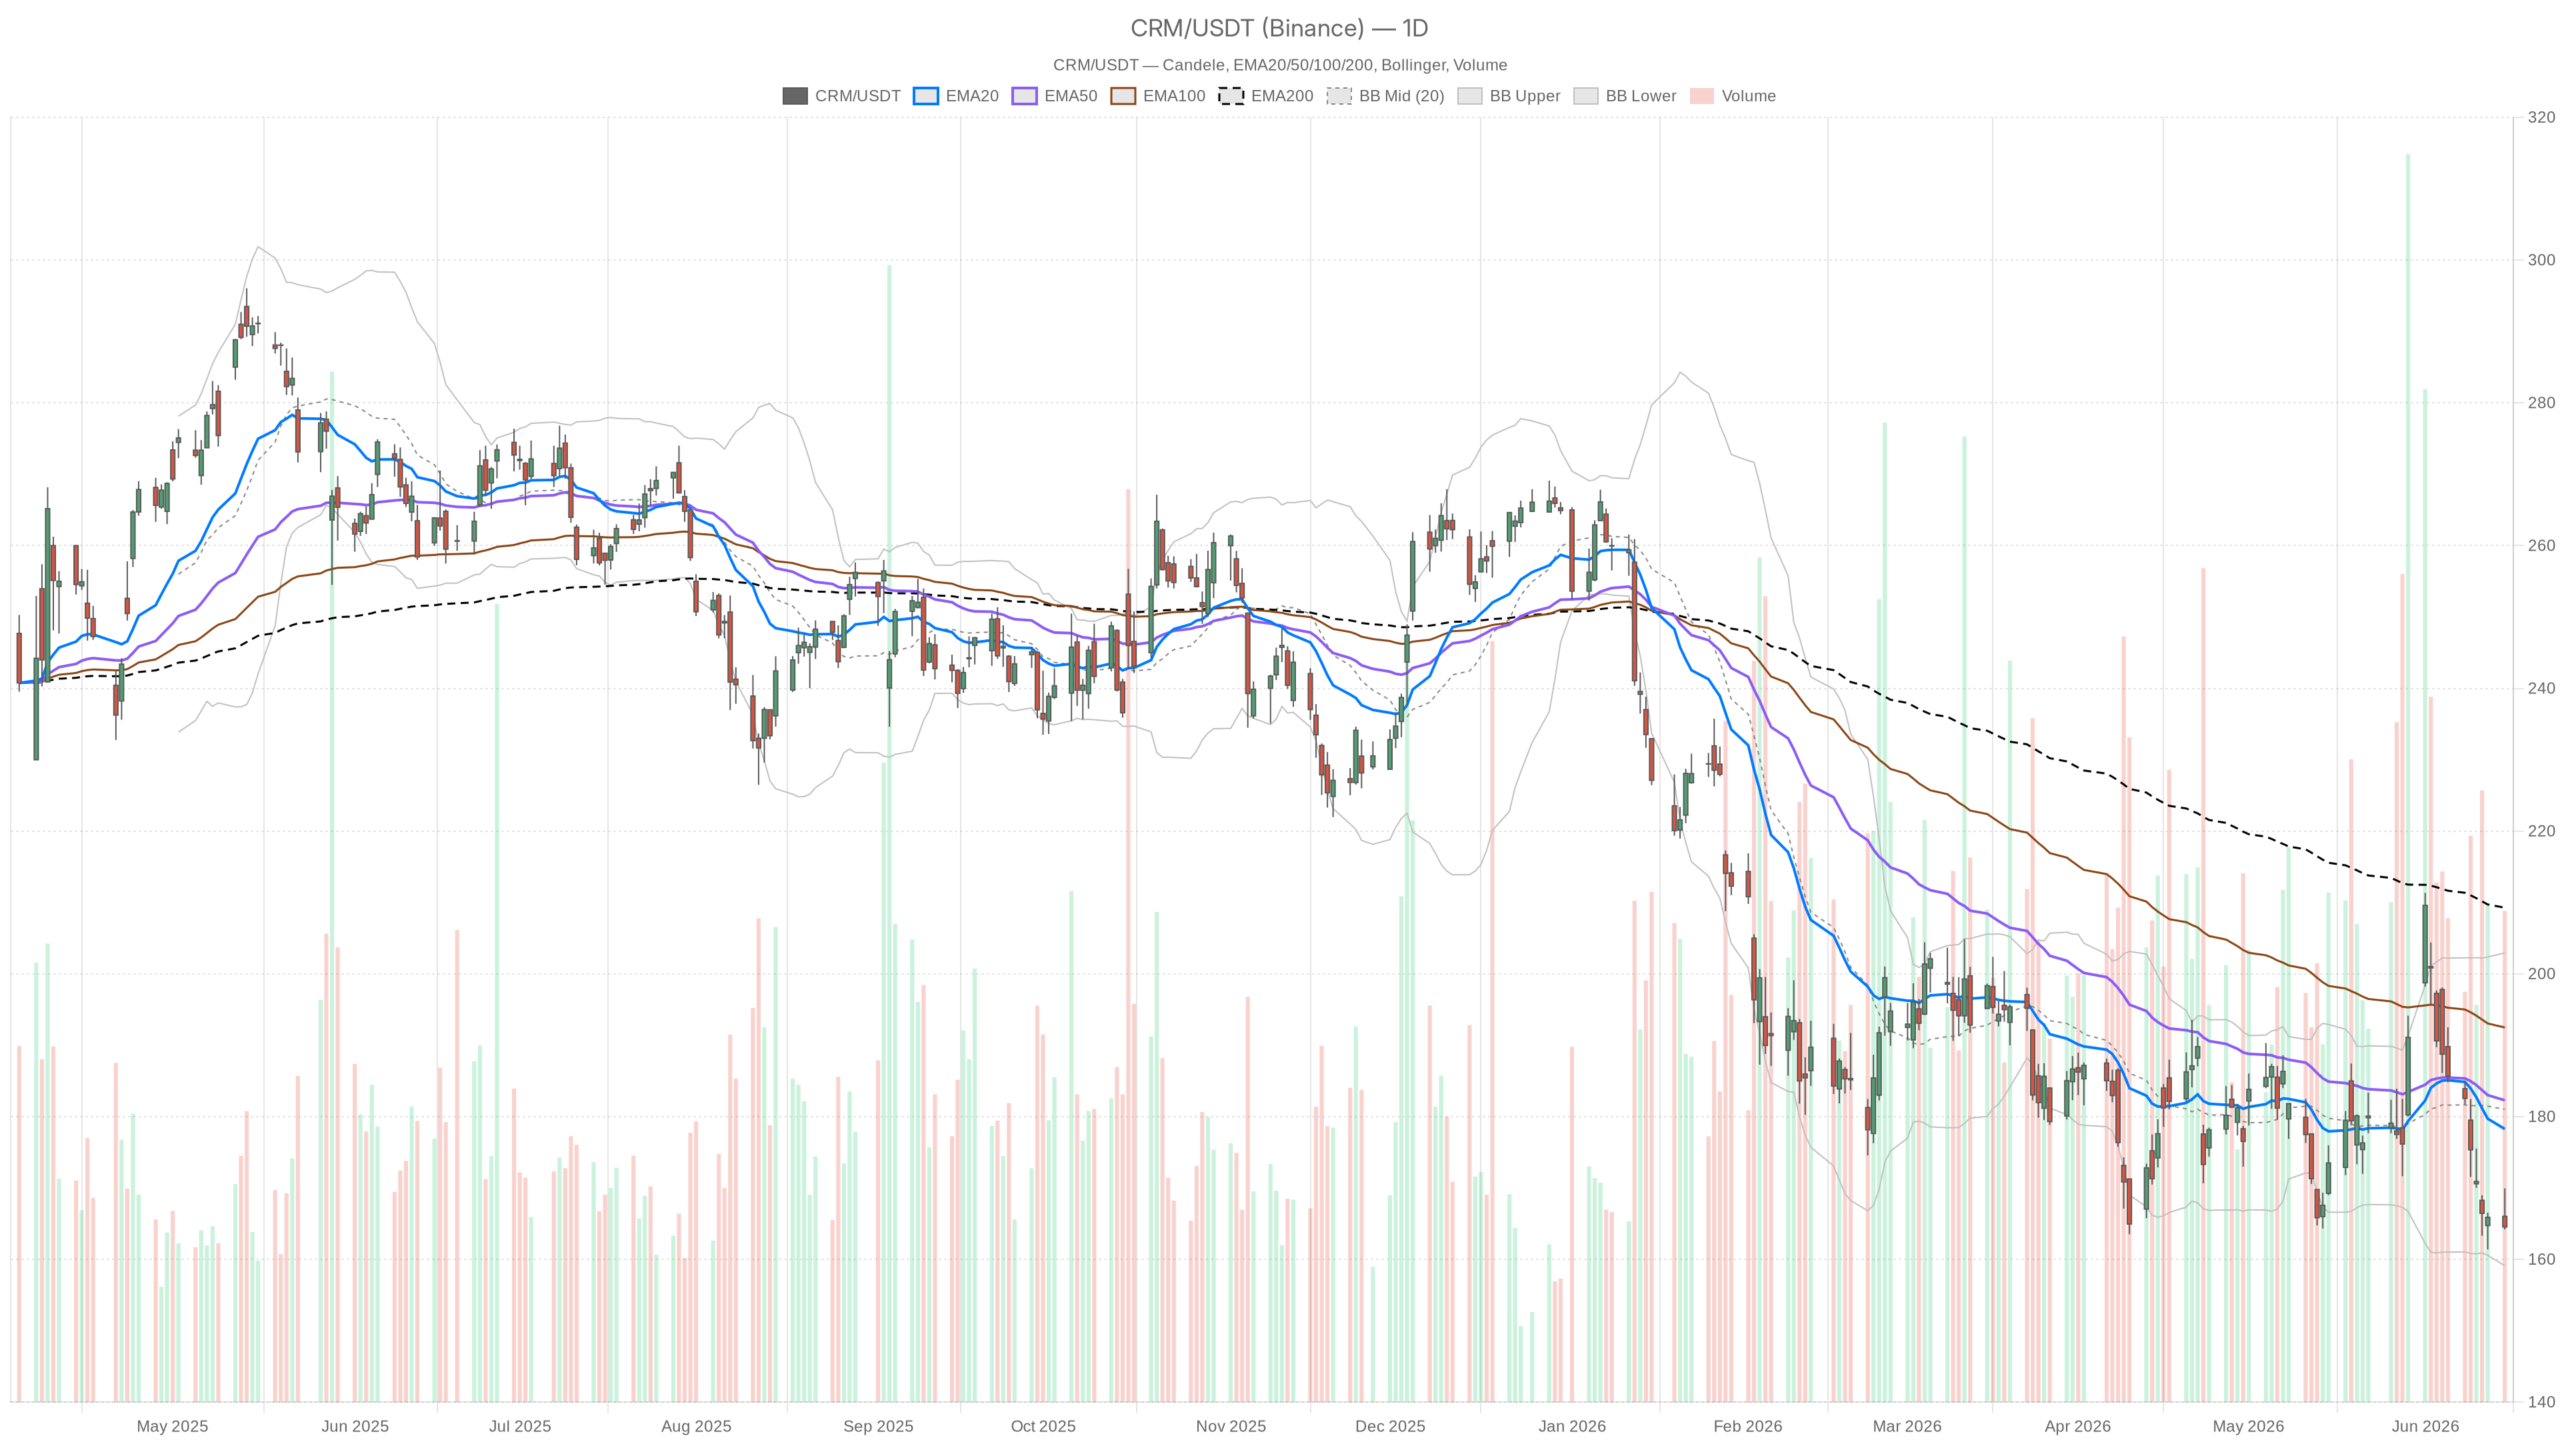 CRM — daily chart with candles, EMA20/EMA50 and volumes.
Key points
- CRM closes at $164.55, below the daily pivot at 166.23
- EMA20 ($178), EMA50 ($182) and EMA200 ($209) all above the price and sloping downward
- Daily MACD at -3.16 with histogram at -2.74: bearish momentum is accelerating
- The $3.6 billion acquisition of Fin breaks a nine-session losing streak
- Critical support at 162.52 (S1), immediate resistance at 166.23 (pivot)
Is the bearish trend structural?
CRM’s technical picture leaves no room for doubt: the trend is bearish on all timeframes, with the price far from every relevant moving average. The stock is well below the EMA20 at 178.26, below the EMA50 at 182.29 and very far from the EMA200 at 209.27. This is not a physiological correction, but a consolidated bearish trend in which every bounce has found sellers ready to step back in.
The model defines the regime as “bearish” on the daily. The numbers confirm this reading across the board. The interruption of the nine-session losing streak, which came precisely with the acquisition announcement, does introduce an element to watch. It is not a reversal. But it is a signal that something in sentiment might be starting to shift.
What are the moving averages signaling on the daily?
The EMA configuration is in perfect descending alignment: EMA20 at 178.26, EMA50 at 182.29, EMA200 at 209.27 — all above the current price and sloping downward. The stock has not touched the EMA20 for weeks. A structure of this kind, with the price so far from all the averages, indicates a phase of dominant trend and not simple sideways movement.
The RSI at 37.76 is in a weak area, close to oversold territory without having reached it yet. There is still theoretical room for further declines before the market reaches conditions of technical exhaustion. This is not a signal of an imminent bounce, but confirmation that bearish pressure has not yet run out.
MACD and Bollinger Bands: does the pressure continue?
Yes, and clearly so. The daily MACD at -3.16 shows a widening gap versus the signal at -0.42, with the histogram at -2.74. This accelerated bearish divergence indicates that selling momentum is not slowing: it is increasing. There are still no signs of a possible bullish cross on the horizon.
The Bollinger Bands place the price just above the lower band at $159.10. The middle band is at 181.02, about 17 points away from the current quote. The fact that the price is walking along the lower band confirms the strength of the bearish move. Historically, this position can precede technical rebounds. But it requires confirmation on volume and momentum before becoming a reliable trading signal.
The daily ATR at $9.97 indicates volatility that is still high. Each session can move the stock by almost 10 points. This is something short-term traders cannot ignore in their risk management.
Do the pivot points confirm intraday weakness?
CRM closed at $164.55, below the daily pivot point at 166.23, a signal that intraday traders interpret as seller dominance during the session. R1 is at 168.26 and S1 at 162.52. As long as the stock does not reclaim and hold 166.23, pressure remains to the downside, with the next relevant support at 162.52.
Does the hourly timeframe show signs of recovery?
The one-hour chart shows the first potentially positive note. The hourly MACD records a histogram at +0.50, the first micro-divergence after weeks of exclusively negative readings. It is not a reversal, but it is a signal worth monitoring.
The context, however, remains heavy. The RSI at 34.41 is already closer to the critical 30 area. The price at 164.63 is below the EMA20 at 167.15, below the EMA50 at 172.81 and far from the EMA200 at 179.41. The bearish structure has not changed: it has simply paused. Volume on the last hourly candle, 1.95 million shares, is consistent with a stabilization phase, not with a bullish acceleration.
The hourly Bollinger Bands are tight: upper at 168.12, lower at 163.55. The price is oscillating near the center. The market is looking for a direction without having found it yet. Any break of the bands, in this context, could generate a fast and decisive move.
The 15-minute chart: what does it show?
The 15-minute timeframe reflects a phase of compression and uncertainty. The price is confined between support at 164.16 and resistance at 165.14 — a range of less than one dollar. Buyers are trying to hold the level but are not yet able to advance convincingly.
The MACD is slightly negative, with a histogram at -0.20. Short-term micro-pressure remains oriented to the downside. The RSI at 36.74 confirms weakness, well below the neutral threshold. The EMA20 at 165.68 and the EMA50 at 166.33 both act as immediate dynamic resistance. Every attempt at a bounce must first get through these obstacles.
Bullish scenario: what is needed to reverse course?
To start a credible recovery, CRM must first regain the daily pivot at 166.23. Without this step, every bounce risks being sold. The second obstacle is the daily EMA20 at 178.26: a move back above this average with a confirming close would significantly change the chart’s reading.
In the meantime, the daily MACD must at least narrow the gap between line and signal. A bullish cross could still require several days of positive sessions. The fundamental catalyst — the $3.6 billion acquisition of Fin — could speed up the process if institutional investors start to view the deal as strategically sound. If the market digests the news positively in the coming days, the price could attempt a return toward the 168–170 area, where R1 and the resistance of the hourly bands are located.
Bearish scenario: which levels are decisive?
A break of S1 support at 162.52 would be an immediately negative signal. It would bring the price toward the lower Bollinger Band at 159.10, which is the strongest short-term technical reference. If that level also failed, there would be no reliable references until the 150–155 area.
Any deterioration in the macro context — rising rates, risk-off sentiment — would amplify the decline, given the high daily ATR. In that scenario, the daily MACD could accelerate further downward, making any rebound difficult to sustain.
The bifurcation point: what to watch now
Salesforce shares are at a clear bifurcation point. The technical structure is unequivocally bearish. But the news of the $3.6 billion acquisition introduces a variable that charts alone cannot resolve. The most attentive traders are monitoring three levels: 162.52 as support that must hold, 166.23 as the dividing line between weakness and neutrality, and the 168–170 area as the first resistance zone to clear before starting to talk about a recovery.
The hourly momentum with a slightly positive MACD histogram remains the only technical element that partially balances the picture. For now, the analysis suggests waiting for a clear directional confirmation. The market is in a reflective pause. The next move will likely be decided by the combination of the reaction to the Fin acquisition and the holding of the identified technical supports.
FAQ
What are the key support levels for Salesforce shares?
The immediate support is S1 at $162.52. Below this level, the lower Bollinger Band at $159.10 is the strongest short-term technical reference. If it breaks, there are no reliable references until the 150–155 area.
Can the Fin acquisition reverse the bearish trend?
The news has already interrupted the nine-session losing streak, but on its own it is not enough to reverse a structural trend. Technical confirmations are needed: reclaiming the pivot at 166.23 and, above all, regaining the daily EMA20 at 178.26 with convincing volumes.
Which levels must CRM break for a bullish reversal?
The first obstacle is the daily pivot at 166.23. Next comes the 168–170 area — where R1 and the resistance of the hourly bands converge — and finally the daily EMA20 at 178.26, which is the real technical watershed for a regime change.
The analysis is for informational purposes only and does not constitute financial advice or an investment solicitation.
{“@context”:”https://schema.org”,”@type”:”FAQPage”,”mainEntity”:[{“@type”:”Question”,”name”:”What are the key support levels for Salesforce shares?”,”acceptedAnswer”:{“@type”:”Answer”,”text”:”The immediate support is S1 at $162.52. Below this level, the lower Bollinger Band at $159.10 is the strongest short-term technical reference. If it breaks, there are no reliable references until the 150–155 area.”}},{“@type”:”Question”,”name”:”Can the Fin acquisition reverse the bearish trend?”,”acceptedAnswer”:{“@type”:”Answer”,”text”:”The news has already interrupted the nine-session losing streak, but on its own it is not enough to reverse a structural trend. Technical confirmations are needed: reclaiming the pivot at 166.23 and, above all, regaining the daily EMA20 at 178.26 with convincing volumes.”}},{“@type”:”Question”,”name”:”Which levels must CRM break for a bullish reversal?”,”acceptedAnswer”:{“@type”:”Answer”,”text”:”The first obstacle is the daily pivot at 166.23. Next comes the 168–170 area — where R1 and the resistance of the hourly bands converge — and finally the daily EMA20 at 178.26, which is the real technical watershed for a regime change. The analysis is for informational purposes only and does not constitute financial advice or an investment solicitation.”}}]}
Disclaimer: This article is for informational purposes only and does not constitute financial advice, investment recommendations or a solicitation to buy or sell financial instruments or cryptocurrencies. The analyses do not guarantee future results. Investments in crypto-assets and financial markets involve a high risk of capital loss. Always do your own research (DYOR) and consult a qualified financial advisor before making any decision.
Content created with the assistance of artificial intelligence and human editorial review.


You May Also Like

Crypto Hack: Drift Protocol Drained Over $200M in Private Key Breach

Ripple News: Flutterwave Stake Opens RLUSD and XRP Ledger Push in Africa

Shock confession: Trump influencer admits she 'fell for Russian propaganda'


