

Zcash today at $526 with Extreme Fear at 23: who is quietly buying?
As of 16 June 2026, Zcash today is in an interesting consolidation phase. The price is around 526 dollars, with a bullish technical structure on the daily. We are not facing an imminent breakout nor a collapse, but a grey area that deserves attention.
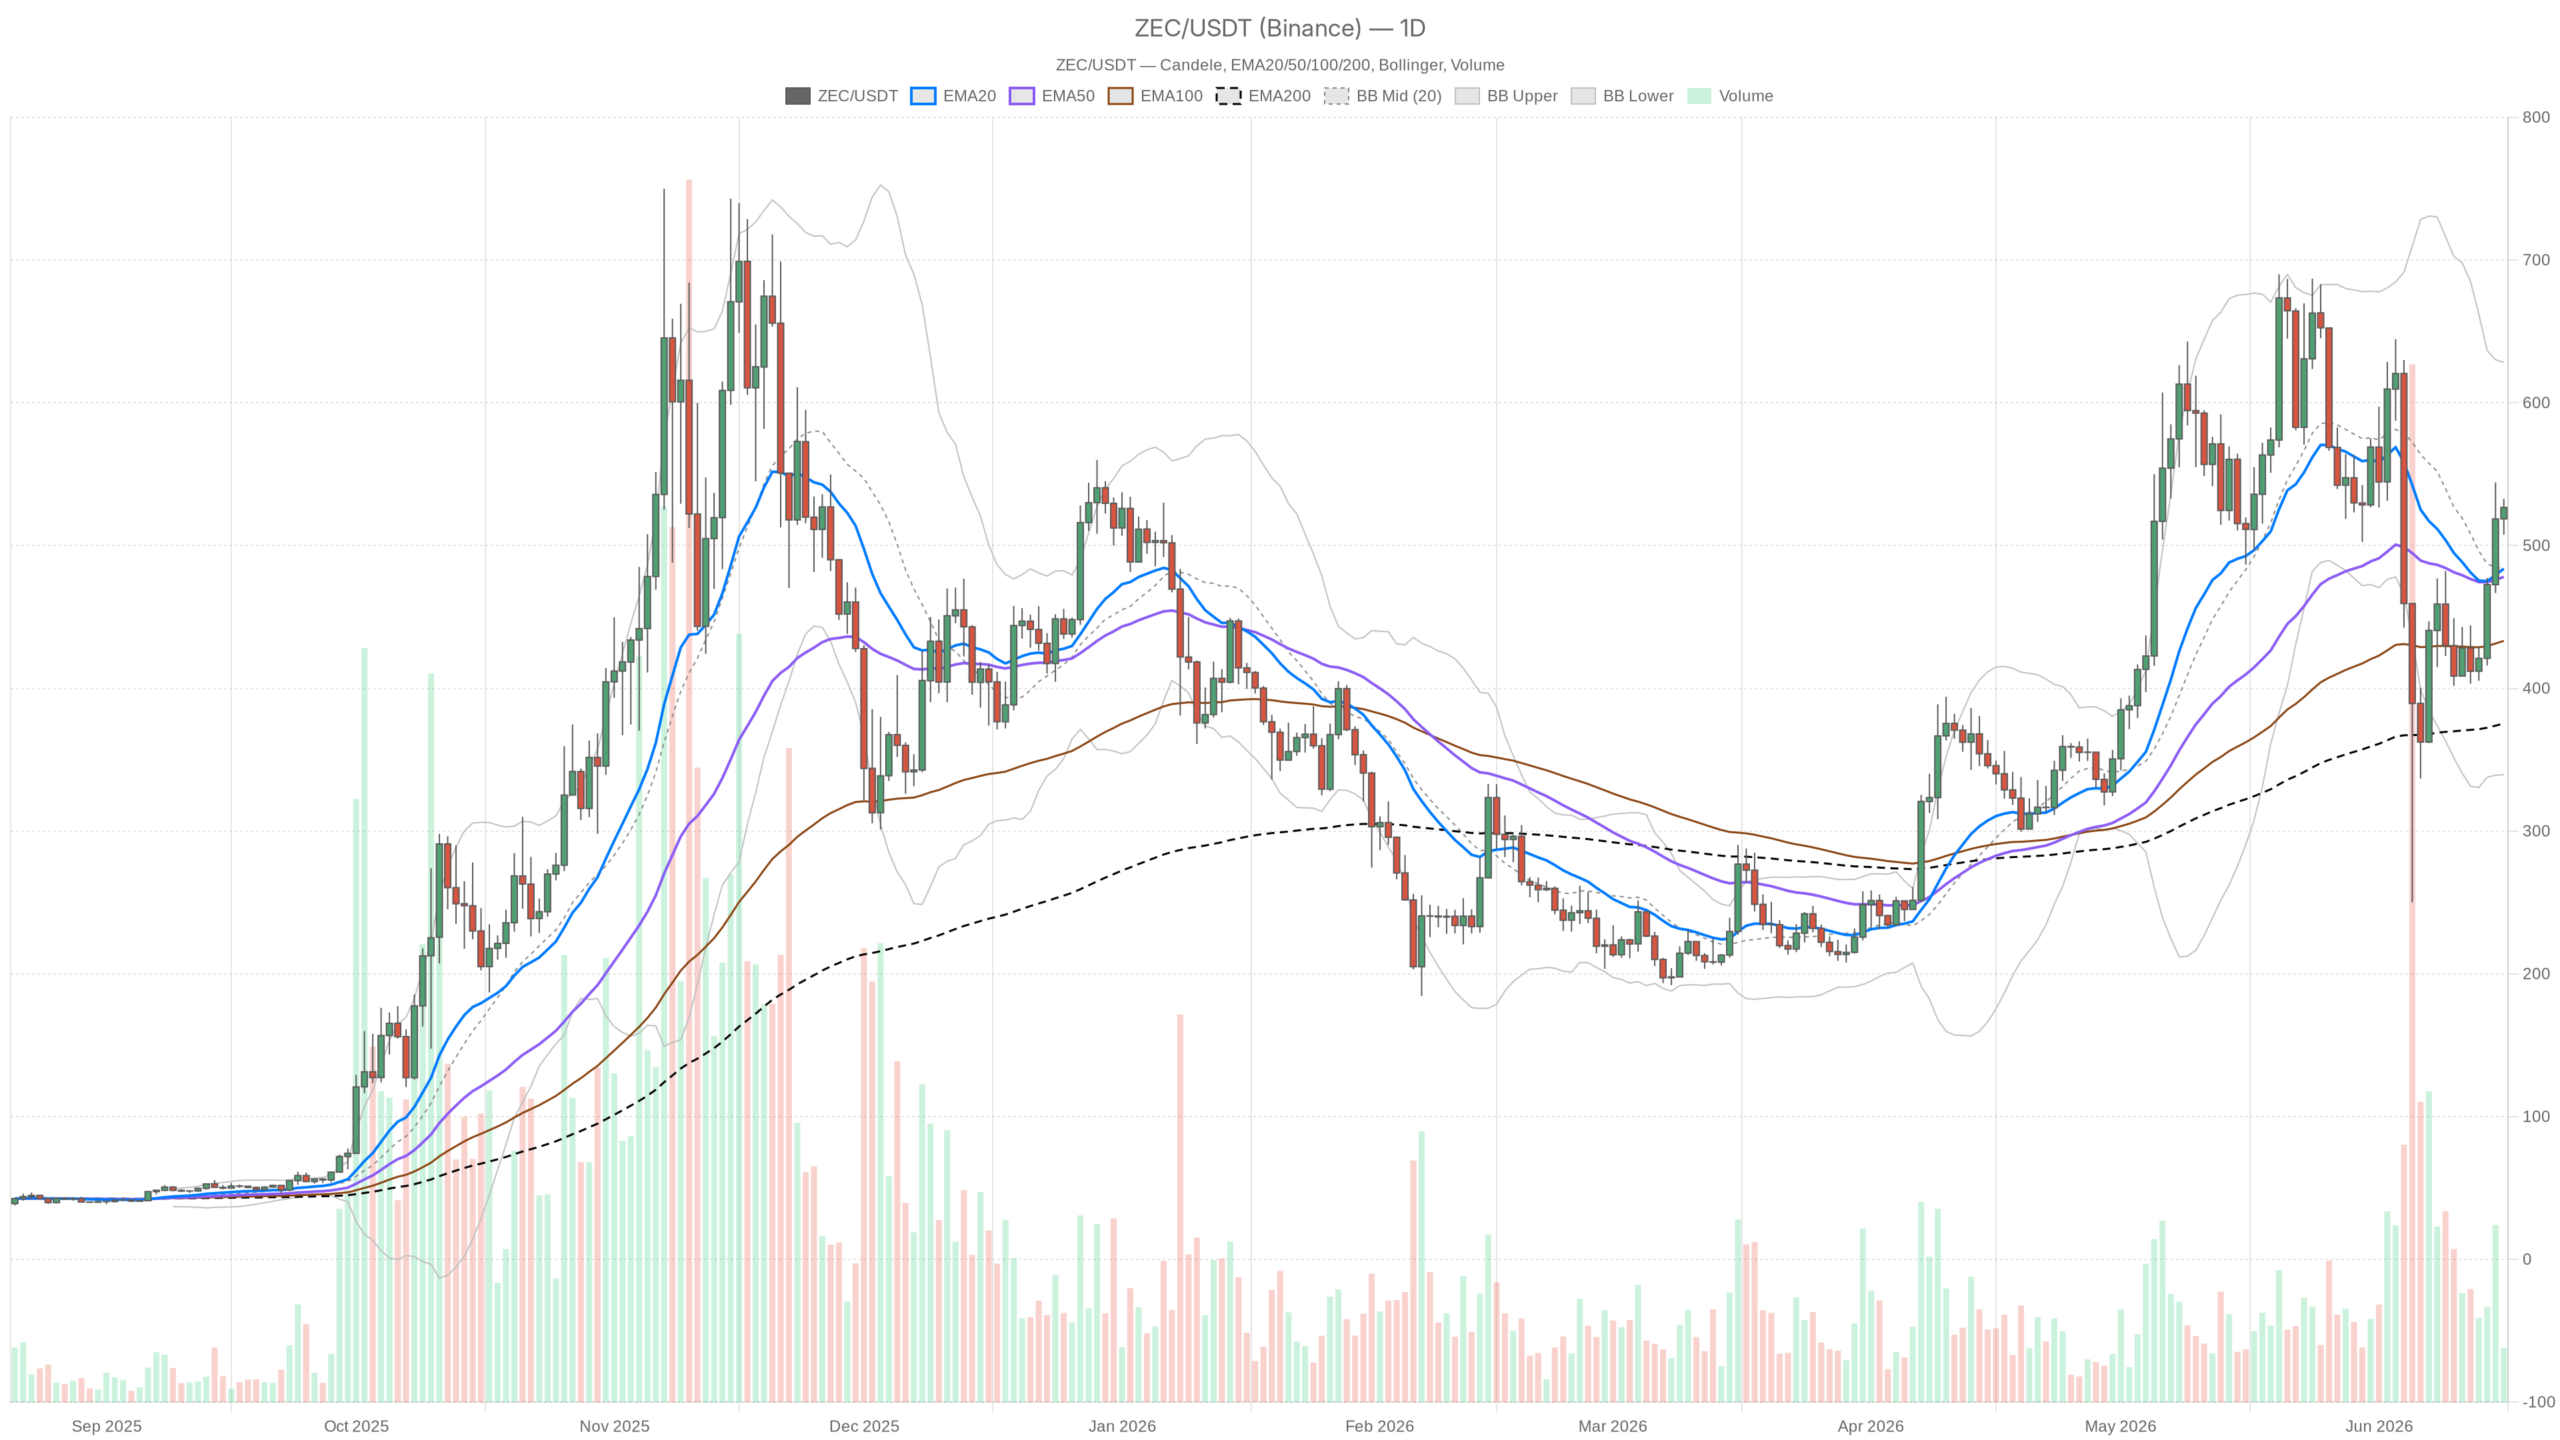 ZEC/USDT — daily chart with candles, EMA20/EMA50 and volumes.
Key points
- Zcash is trading at 526 dollars, above the daily EMA20 and EMA50 in a bullish configuration.
- The daily MACD shows a positive histogram at +5.77 in expansion, with the crossover not yet occurred.
- The hourly RSI at 64.49 indicates buying pressure without overbought.
- The Fear & Greed Index stands at 23 (Extreme Fear), in contrast with the constructive technical structure.
- Key resistance at $537.10 (daily R1), support at $511.99 (daily S1).
The underlying structure: bullish, but with reservations
The regime on the daily is classified as bullish and the numbers partially confirm it. The Zcash price at 526.74 dollars is well above the EMA20 (483.83) and EMA50 (478.07), both locked in an orderly configuration. The really striking data point is the distance from the EMA200, stuck at 375.39: Zcash has recovered over 150 dollars compared to its long-term average. This is not a dead cat bounce: it is a progressive rebuilding of the bullish bias.
However, the MACD on the daily deserves an honest reading. The MACD line is still negative at -14.89, as is the signal at -20.66. The histogram, however, is positive at +5.77 and expanding, which means that the divergence between the two lines is narrowing. In practice, the bearish push is running out and momentum is slowly turning back in favour of buyers. The crossover, however, has not yet occurred: those expecting a traditional confirmation will have to wait a little longer.
Short-term momentum: hot but not overheated
Moving to the hourly, the picture becomes more lively. The RSI at 64.49 signals sustained buying pressure, without however touching the overbought zone. The price is above all dynamic moving averages: EMA20 at 517.52, EMA50 at 492.88 and EMA200 at 460.47. The intraday structure is compact and coherent. There is, however, a small warning sign: the MACD on H1 shows a negative histogram at -2.33, with the line (9.41) having just crossed below the signal (11.74). This is not a reversal signal, but it suggests that the bullish push of the last few hours is cooling down.
On the 15 minutes the context is essentially neutral-constructive. The RSI at 56.11 does not declare anything urgent, the MACD is practically flat with a histogram at +0.06, and the price is floating above all EMAs. This type of structure, flat and above the averages, tends to precede a directional move. The direction, however, is not yet written.
Bollinger Bands and pivots: where the game is played
The Bollinger Bands on the daily provide valuable information on the positioning of the price. With the upper band at 628.38 and the lower at 339.47, the price at 526.74 is just above the mid-band (483.93). This means that there is still ample room to the upside within the channel. There is no compression on the daily nor an imminent squeeze: there is only a price that has crossed above the median line and now has to decide whether to push towards the upper band or go back to test the dynamic support.
The daily pivots tell a simple story: the pivot point is at 522.34, R1 at 537.10 and S1 at 511.99. Zcash is exactly between PP and R1, in a zone of indecision. On the hourly the pivots tighten a lot (PP 526.41, R1 528.62, S1 524.48), confirming that we are in a very tight range in the immediate term. Any move of a few percentage points will resolve this stalemate.
The daily ATR at 73.93 dollars is important: it says that Zcash moves on average by almost 74 dollars per day. It is a volatile asset, not for beginners, and stop levels must be sized accordingly.
The macro context does not help confidence
According to CoinGecko data, total crypto market cap stands at around 2.358 trillion dollars with a positive change in the last 24 hours of about +1.48%. Bitcoin dominates with 56.5% of total capitalization, a level that historically tends to compress altcoins in the short term. Zcash, in this context, has to fight against a market bias that still favours BTC.
The Fear & Greed index at 23 — Extreme Fear — is perhaps the most interesting data point of the whole picture. Zcash today is holding at 526 dollars, in a bullish structure, with market sentiment screaming fear. This dichotomy is often fertile for contrarians: when the price holds up well despite poor sentiment, it means that someone is buying quietly. Caution, however: Extreme Fear can also be a precursor of further declines, not just an opportunity.
Bullish scenario
If Zcash manages to decisively break above the daily R1 at 537.10 with expanding volumes, the path opens towards the upper Bollinger band on the daily, in the 628 dollar area. The technical catalyst would be the MACD crossover on the daily, which would lead systematic traders to add to the position. In this scenario, pullbacks towards the daily EMA20 (484 area) would become buying opportunities. This scenario is invalidated by a daily close below 478 dollars (EMA50 area), which would mark a break of the current bullish structure.
Bearish scenario
If momentum on H1 continues to lose strength and the price falls below the hourly S1 at 524.48, the first natural destination is the daily pivot area at 522.34. A break of that level as well would bring the price back towards the daily S1 at 511.99, an area that roughly coincides with the EMA20 on the daily. A decisive loss of this area would radically change the short-term picture. The bearish scenario is invalidated if the price closes above 537.10 on an hourly basis with sustained volumes.
How to read this moment
Zcash is in that uncomfortable point where the underlying structure is constructive but immediate triggers for a clear move are missing. Those operating on the daily can remain positioned long with stops below the EMA50, aware of the high volatility. The ATR at 74 dollars is not a figure to ignore. Those operating intraday must deal with a tight range and an hourly MACD that has already lost momentum: the risk of false breakouts is real in these conditions.
The market is not shouting anything about Zcash at this moment. It is whispering. And in certain contexts, knowing how to listen to a whisper is worth more than chasing a shouted signal.
FAQ
Is Zcash in a bullish or bearish trend?
The structure on the daily is classified as bullish. The price remains above EMA20, EMA50 and EMA200, with the MACD in progressive recovery. The definitive bullish crossover on the daily is still missing, but momentum is gradually turning back in favour of buyers.
What are the key levels to monitor?
On the upside, the immediate resistance is the daily R1 at $537.10, followed by the upper Bollinger band in the $628 area. On the downside, the primary support is the daily S1 at $511.99, with the EMA50 at $478 as a critical level for maintaining the bullish structure.
What does Extreme Fear at 23 mean for Zcash?
The Fear & Greed index at 23 signals extreme fear in the market. This contrasts with the technical resilience of Zcash above $520, suggesting possible quiet accumulation. However, Extreme Fear can also precede further declines and should not be interpreted as an automatic bullish signal.
{“@context”:”https://schema.org”,”@type”:”FAQPage”,”mainEntity”:[{“@type”:”Question”,”name”:”Is Zcash in a bullish or bearish trend?”,”acceptedAnswer”:{“@type”:”Answer”,”text”:”The structure on the daily is classified as bullish. The price remains above EMA20, EMA50 and EMA200, with the MACD in progressive recovery. The definitive bullish crossover on the daily is still missing, but momentum is gradually turning back in favour of buyers.”}},{“@type”:”Question”,”name”:”What are the key levels to monitor?”,”acceptedAnswer”:{“@type”:”Answer”,”text”:”On the upside, the immediate resistance is the daily R1 at $537.10, followed by the upper Bollinger band in the $628 area. On the downside, the primary support is the daily S1 at $511.99, with the EMA50 at $478 as a critical level for maintaining the bullish structure.”}},{“@type”:”Question”,”name”:”What does Extreme Fear at 23 mean for Zcash?”,”acceptedAnswer”:{“@type”:”Answer”,”text”:”The Fear & Greed index at 23 signals extreme fear in the market. This contrasts with the technical resilience of Zcash above $520, suggesting possible quiet accumulation. However, Extreme Fear can also precede further declines and should not be interpreted as an automatic bullish signal.”}}]}
Disclaimer: This article is for informational purposes only and does not constitute financial advice, investment recommendation or a solicitation to buy or sell financial instruments or cryptocurrencies. The analyses do not guarantee future results. Investments in crypto-assets and financial markets involve a high risk of loss of capital. Always do your own research (DYOR) and consult a qualified financial advisor before making any decision.
Content created with the assistance of artificial intelligence and with human editorial review.


You May Also Like

Blue Sage Solutions Expands Embedded AI Capabilities Across the Mortgage Lifecycle

South Korea Stablecoin Legislation: FSC Accelerates Crucial Regulatory Framework and Tax Review

Defying Trump’s Hopes of a Rate Cut, Warsh Holds Rates Steady at 3.75%


