

Microsoft shares at $399, below all the moving averages: the rebound is not enough

Microsoft stock is in a delicate phase. MSFT is trading around 399 dollars, below all the main moving averages on the daily chart. The technical structure remains predominantly bearish. The rebound of the last few hours has not yet reversed the trend. On the fundamental side, a class action linked to the slowdown of Azure adds uncertainty.
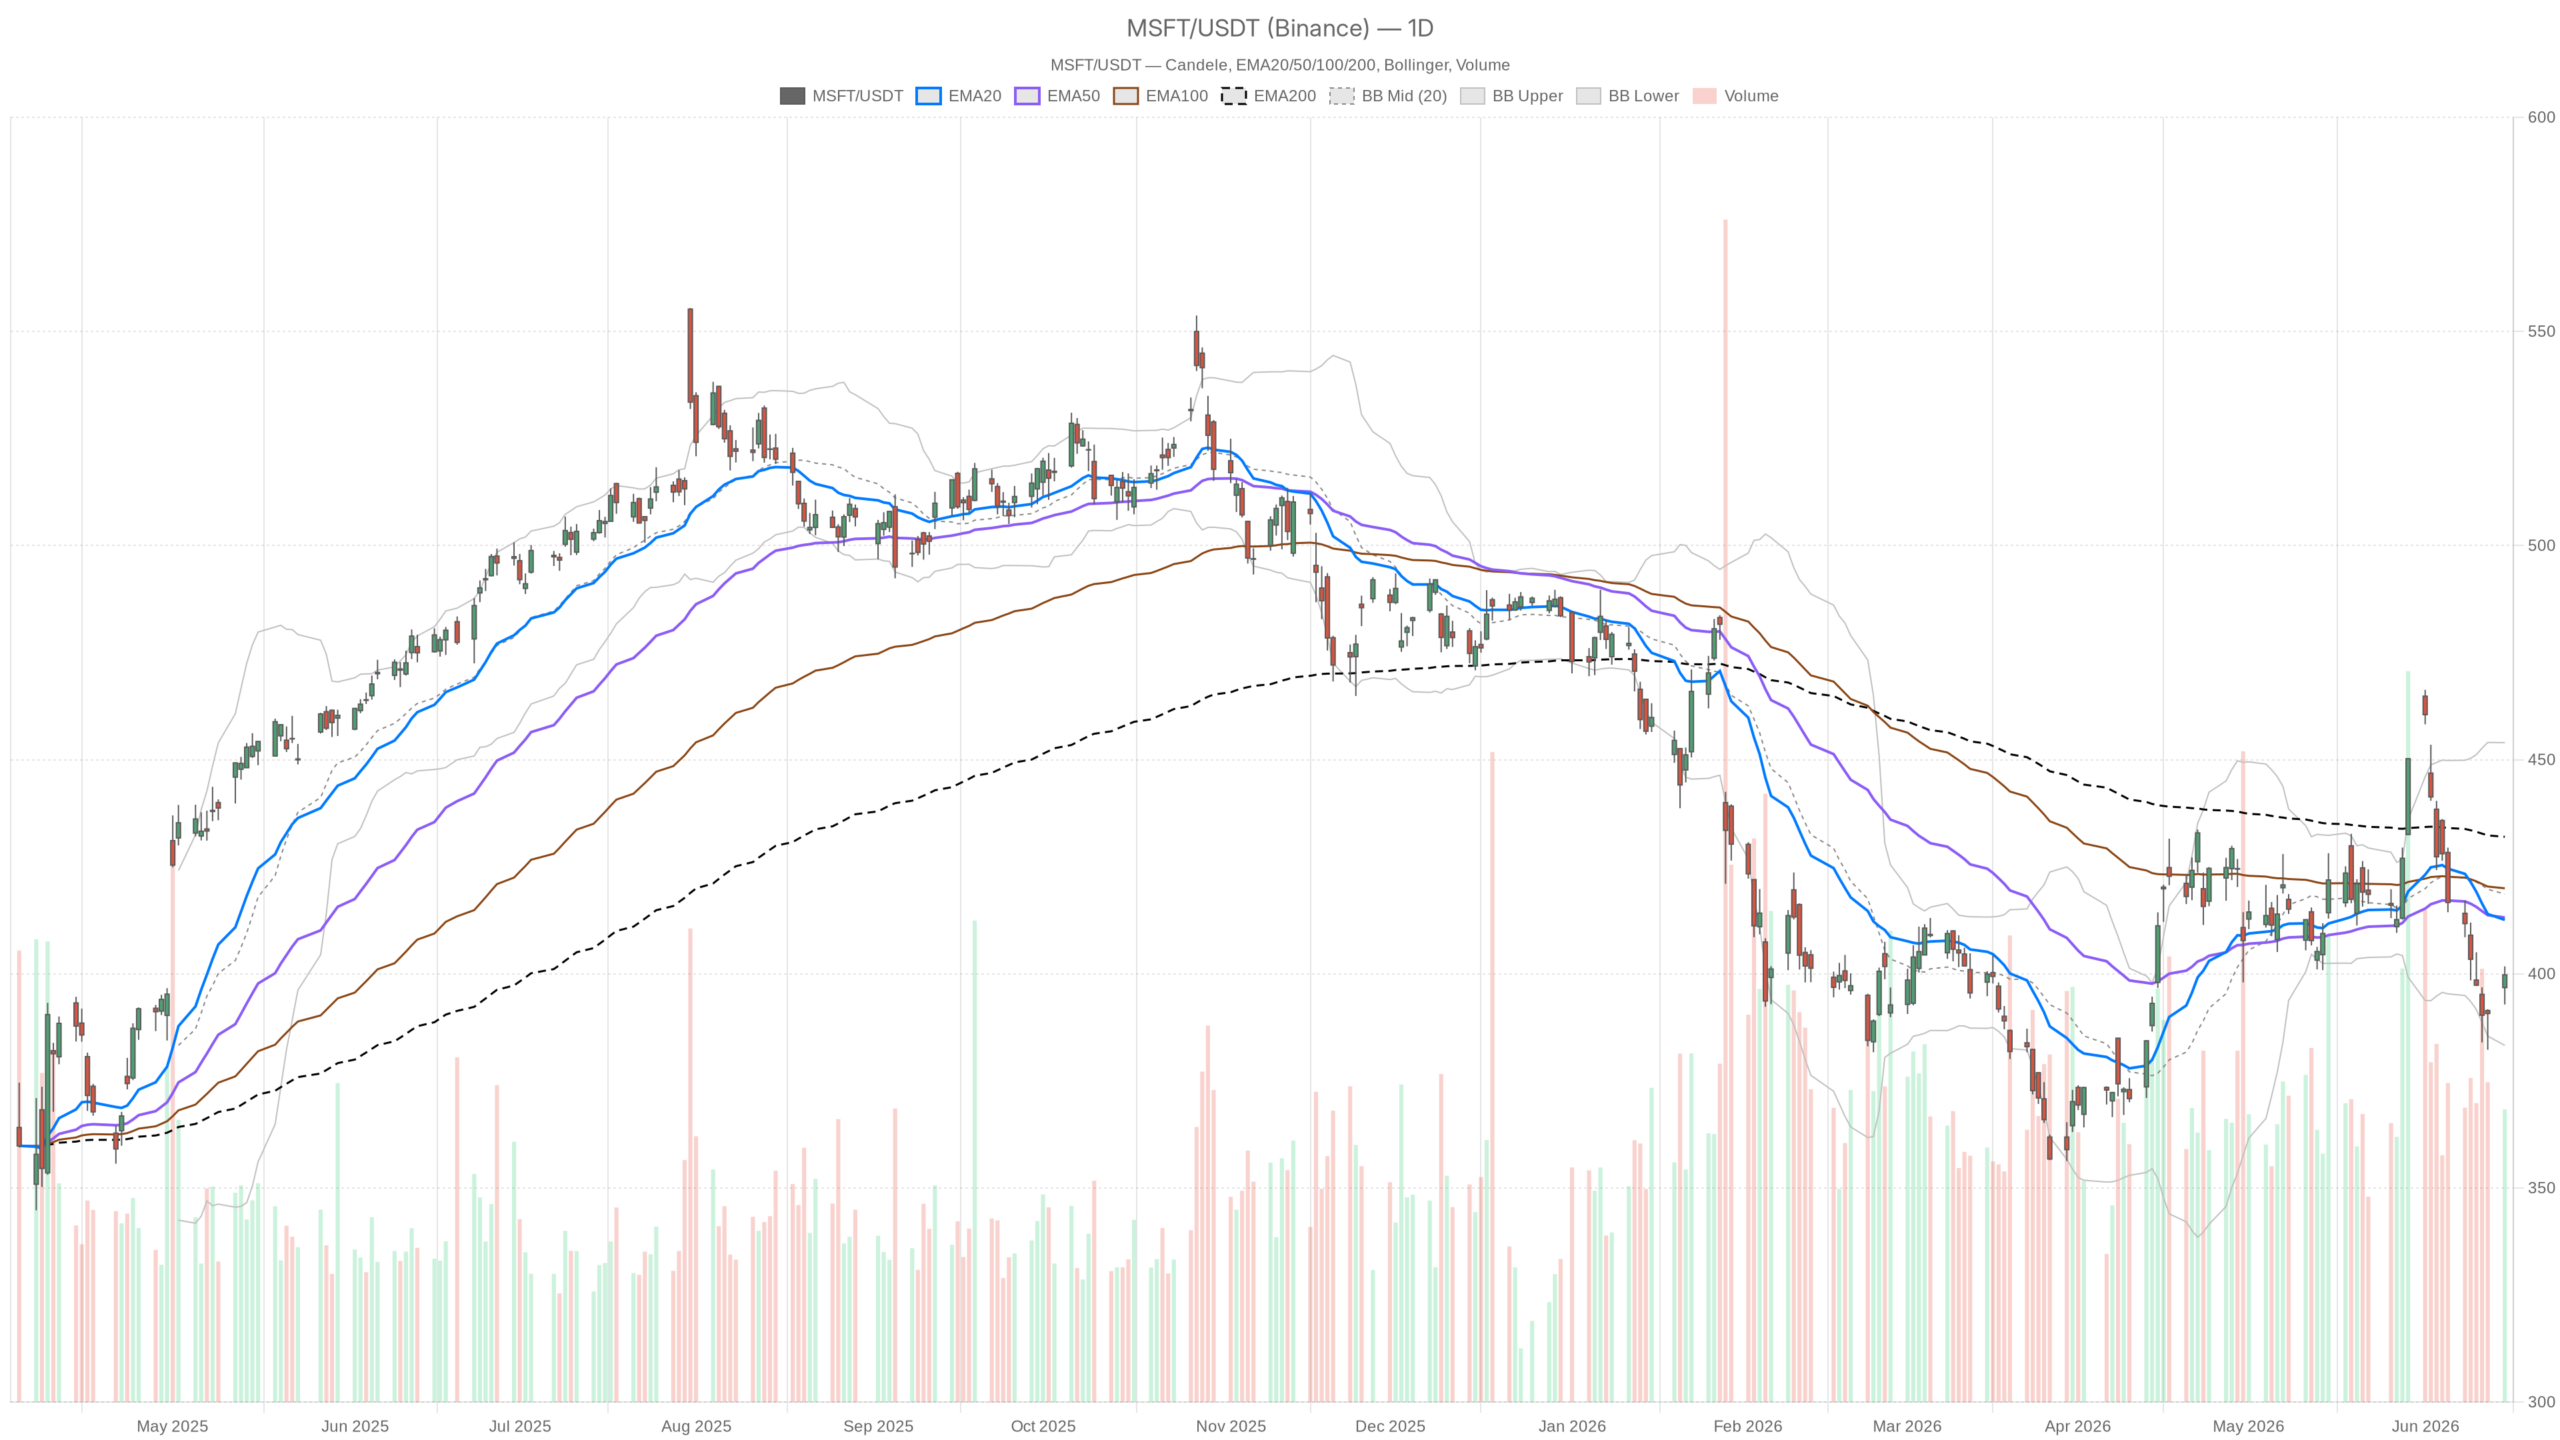 MSFT — daily chart with candles, EMA20/EMA50 and volumes.
Key points
- MSFT is trading at $399.76, below EMA20, EMA50 and EMA200 on the daily chart
- Daily RSI at 42.72: not yet oversold, there is still room for further declines
- Daily MACD with histogram at -4.75: bearish pressure remains strong
- Key resistance at $403–404; breaking above it would change the short-term structure
- Support S1 at $394.49; holding this level is crucial to avoid a test of $383.30
The daily trend is bearish: MSFT remains below all moving averages
The dominant regime on MSFT is bearish. On the daily chart, the price closes at $399.76, pressed below the EMA20 at 412.61, the EMA50 at 413.16 and the EMA200 at 432.01. When a stock is simultaneously below all three exponential averages, the signal is unequivocal.
The daily RSI at 42.72 reinforces this reading. We are not in deep oversold territory: technically the market can still fall before reaching an exhaustion area. The classic conditions for a structural rebound have not yet formed.
The daily MACD is even clearer. The line at -4.67 remains far from the signal at +0.08, with a histogram at -4.75. The divergence is wide. Bearish pressure on the stock has built up over time and still shows no signs of easing.
Bollinger and pivots: the price is moving in the lower half of the channel
MSFT is moving in the lower band of the Bollinger channel, far from the equilibrium zone. The middle band is at 418.64 and the lower band at 383.30. The price at $399.76 is not yet touching the lower band. But the distance from the middle band tells the story of a stock that has lost contact with its own equilibrium area.
The daily pivots show a pivot point at 398.12, with resistance R1 at 403.39 and support S1 at 394.49. The price is just above the PP, in a tension zone. A break below $394.49 would open space towards the lower part of the channel. The ATR at 13.46 suggests potentially wide daily moves: each candle must be interpreted with this in mind.
On the hourly chart a technical recovery is emerging, still to be confirmed
The one-hour timeframe shows the first signs of awakening. The price at $399.97 is above the hourly EMA20 at 396.03. This is the first element that differs from the daily: in the short term a hint of relative strength appears. The RSI1H at 55.8 has returned to a neutral-positive area, indicating that momentum has stopped deteriorating.
The hourly MACD offers the most interesting data. The line remains negative at -0.45, but the signal is at -2.48 and the histogram is positive at +2.03. The divergence is converging from below: momentum is improving, even without having crossed zero yet.
However, the hourly EMA50 at 402.57 and the EMA200 at 414.41 remain above the price. The recovery is real but limited. The upper Bollinger band at 403.07 represents the first significant resistance. In the coming hours, MSFT’s ability to break through this area will say a lot about the quality of the rebound.
Very short term: momentum already shows signs of fatigue
On the 15-minute chart the picture is mixed. The price is moving above EMA20 at 398.50 and EMA50 at 395.91, a positive sign for the very short term. However, the RSI at 63.55 is approaching the 70 threshold. In rebounds within broader bearish trends, this is the area where momentum tends to run out.
The MACD15M has a slightly negative histogram at -0.37. The very short-term push is already losing strength. The 15-minute Bollinger Bands are tight, with the upper band at 401.16 and the lower band at 397.82. The price is close to the upper band, a potential rejection area. The pivot R1 at 400.81 coincides with this short-term resistance area.
In summary, the 15-minute chart indicates that very short-term bullish pressure may be close to a temporary stalling point.
Bullish scenario: it is necessary to break above 403–404 dollars
For a credible recovery of Microsoft stock, the first step is to break above the 403–404 dollar area. Here the hourly EMA50, the upper 1H Bollinger band and the daily R1 resistance converge. It is an area dense with technical obstacles. An hourly close above these levels would change the short-term structure.
On the daily chart, the real change of scenario would require a recovery above EMA20 and EMA50, both around 412–413 dollars. The daily MACD should start to converge, with the histogram reducing the negative differential. The RSI should also rise steadily above 50, indicating a return of relative strength.
The fundamental context could provide support. Wells Fargo maintains a 650 dollar target on MSFT. The debate between falling knife and decade-long buying opportunity remains open. If institutional sentiment turned positive again, the levels mentioned above would become the natural triggers for a recovery.
Bearish scenario: risk is concentrated below 394.49 dollars
The negative scenario is triggered by a break of the daily S1 support at 394.49 dollars. Below that threshold, the next reference is the lower daily Bollinger band at $383.30. A test of this area would imply a significant deterioration for Microsoft stock.
On the fundamental side, the class action over alleged omissions regarding Azure and AI spending represents a concrete reputational risk. New negative details could accelerate selling pressure. MSFT has already lost about 15% over the last year. Below $394, structured technical support is scarce.
The daily regime remains classified as bearish. As long as the price does not steadily recover the main EMAs, every rebound should be treated for what it is: a rebound, not a reversal.
Overall picture: tension between timeframes, the market decides
The current picture is the classic one of a stock in a bearish trend attempting a technical reaction. The daily chart points down. The hourly chart indicates that something is starting to move positively. The 15-minute chart warns that the very short-term move is already close to exhaustion. The tension between timeframes is the key factor to monitor.
Traders are watching the 403–404$ area as the first credible test of the rebound. A failure at that resistance would refocus attention on supports at 394–395$. In the coming sessions, the direction of MSFT will depend on the price’s ability to hold above the daily pivot point and to attempt a break of the hourly resistances.
The analysis of the available data does not yet suggest the conditions for a definitive bullish breakout. The moment calls for observation, not haste. The market is deciding whether this rebound is the beginning of something or just a pause in the decline.
FAQ
What is the dominant trend for Microsoft stock?
Bearish. MSFT is trading below EMA20, EMA50 and EMA200 on the daily chart. The RSI at 42.72 and the MACD with histogram at -4.75 confirm the ongoing pressure.
What are the key levels to watch in the short term?
The immediate resistance is at 403–404$, where the hourly EMA50, the upper 1H Bollinger band and the daily R1 converge. The crucial support is at $394.49 (daily S1); below this threshold there is room down to $383.30.
Is the ongoing rebound credible?
It is a technical rebound that still needs confirmation. The hourly chart shows signs of improvement, with RSI1H at 55.8 and MACD converging. But the hourly EMA50 and EMA200 remain above the price, and the daily chart maintains a bearish setup.
What would be needed for a structural bullish reversal?
A recovery above $412–413 (daily EMA20 and EMA50), accompanied by a converging MACD and an RSI steadily above 50. Without these elements, any upward move remains framed as a technical rebound.
{“@context”:”https://schema.org”,”@type”:”FAQPage”,”mainEntity”:[{“@type”:”Question”,”name”:”What is the dominant trend for Microsoft stock?”,”acceptedAnswer”:{“@type”:”Answer”,”text”:”Bearish. MSFT is trading below EMA20, EMA50 and EMA200 on the daily chart. The RSI at 42.72 and the MACD with histogram at -4.75 confirm the ongoing pressure.”}},{“@type”:”Question”,”name”:”What are the key levels to watch in the short term?”,”acceptedAnswer”:{“@type”:”Answer”,”text”:”The immediate resistance is at 403–404$, where the hourly EMA50, the upper 1H Bollinger band and the daily R1 converge. The crucial support is at $394.49 (daily S1); below this threshold there is room down to $383.30.”}},{“@type”:”Question”,”name”:”Is the ongoing rebound credible?”,”acceptedAnswer”:{“@type”:”Answer”,”text”:”It is a technical rebound that still needs confirmation. The hourly chart shows signs of improvement, with RSI1H at 55.8 and MACD converging. But the hourly EMA50 and EMA200 remain above the price, and the daily chart maintains a bearish setup.”}},{“@type”:”Question”,”name”:”What would be needed for a structural bullish reversal?”,”acceptedAnswer”:{“@type”:”Answer”,”text”:”A recovery above $412–413 (daily EMA20 and EMA50), accompanied by a converging MACD and an RSI steadily above 50. Without these elements, any upward move remains framed as a technical rebound.”}}]}
Disclaimer: This article is for informational purposes only and does not constitute financial advice, investment recommendation or a solicitation to buy or sell financial instruments or cryptocurrencies. The analyses do not guarantee future results. Investments in crypto-assets and financial markets involve a high risk of capital loss. Always do your own research (DYOR) and consult a qualified financial advisor before making any decision.
Content created with the assistance of artificial intelligence and with human editorial review.


You May Also Like

Alleged Huione Money Laundering Boss Extradited to China

Lovable AI’s Astonishing Rise: Anton Osika Reveals Startup Secrets at Bitcoin World Disrupt 2025

Gold Spot Volume on Binance Surges to $80M as Demand Extends Beyond Futures


