

Corning Stock Soared 11% in a Day. Here’s Where GLW Could Go
Key Stats for Corning Stock
- Current Price: $194.92 (June 18, 2026 close, up 11.13% on the day)
- Target Price (Mid): ~$347
- Street Target: ~$198
- Potential Total Return: ~78%
- Annualized IRR: ~14% / year
- Earnings Reaction: -0.75% (April 28, 2026)
- Max Drawdown: 23.15% (March 6, 2026)
Now Live: Discover how much upside your favorite stocks could have using TIKR’s new Valuation Model (It’s free) >>>
What Happened?
Corning (GLW) closed up 11.13% on June 18, a sharp single-day move for a 175-year-old materials company. The catalyst was not one headline. It was the market deciding, again, that the company sitting underneath the AI data center buildout was still underpriced, even after a year that lifted the stock nearly 290%.
That is the position Corning is in. The glass and ceramics maker has become a foundational supplier to AI infrastructure, the physical computing backbone on which AI models run. Every GPU cluster needs to move enormous bandwidth between chips, and that traffic travels over optical fiber. Corning makes the fiber.
Bulls see the surge as validation. Bears see a stock at 93.8x trailing earnings, with executives selling and second-quarter guidance that just missed. The question the market still cannot answer is whether a great business at this price is still a good investment.
Why Corning Surged Again
The move did not come from earnings. Corning last reported on April 28, and the stock fell 0.75% that day. June 18 was a sentiment move, driven by heavy call option volume and renewed enthusiasm for AI optical connectivity.
The foundation underneath it is concrete. In recent months, Corning locked in three of the largest customers in technology. Amazon agreed in early June to a multibillion-dollar, multiyear deal for optical fiber, cable, and connectivity, adding roughly 1,000 jobs in North Carolina. That followed a May agreement with NVIDIA and a Meta deal worth up to $6 billion through 2030.
The NVIDIA arrangement reframed the story. CFO Edward Schlesinger described it at the J.P. Morgan technology conference on May 19: “NVIDIA is actually providing a multibillion-dollar prepayment to support that capital deployment, and they’re making an equity investment.” That changes who carries the risk of building new capacity. The customer is funding the factories, which de-risks the biggest concern about a capital-heavy growth plan.
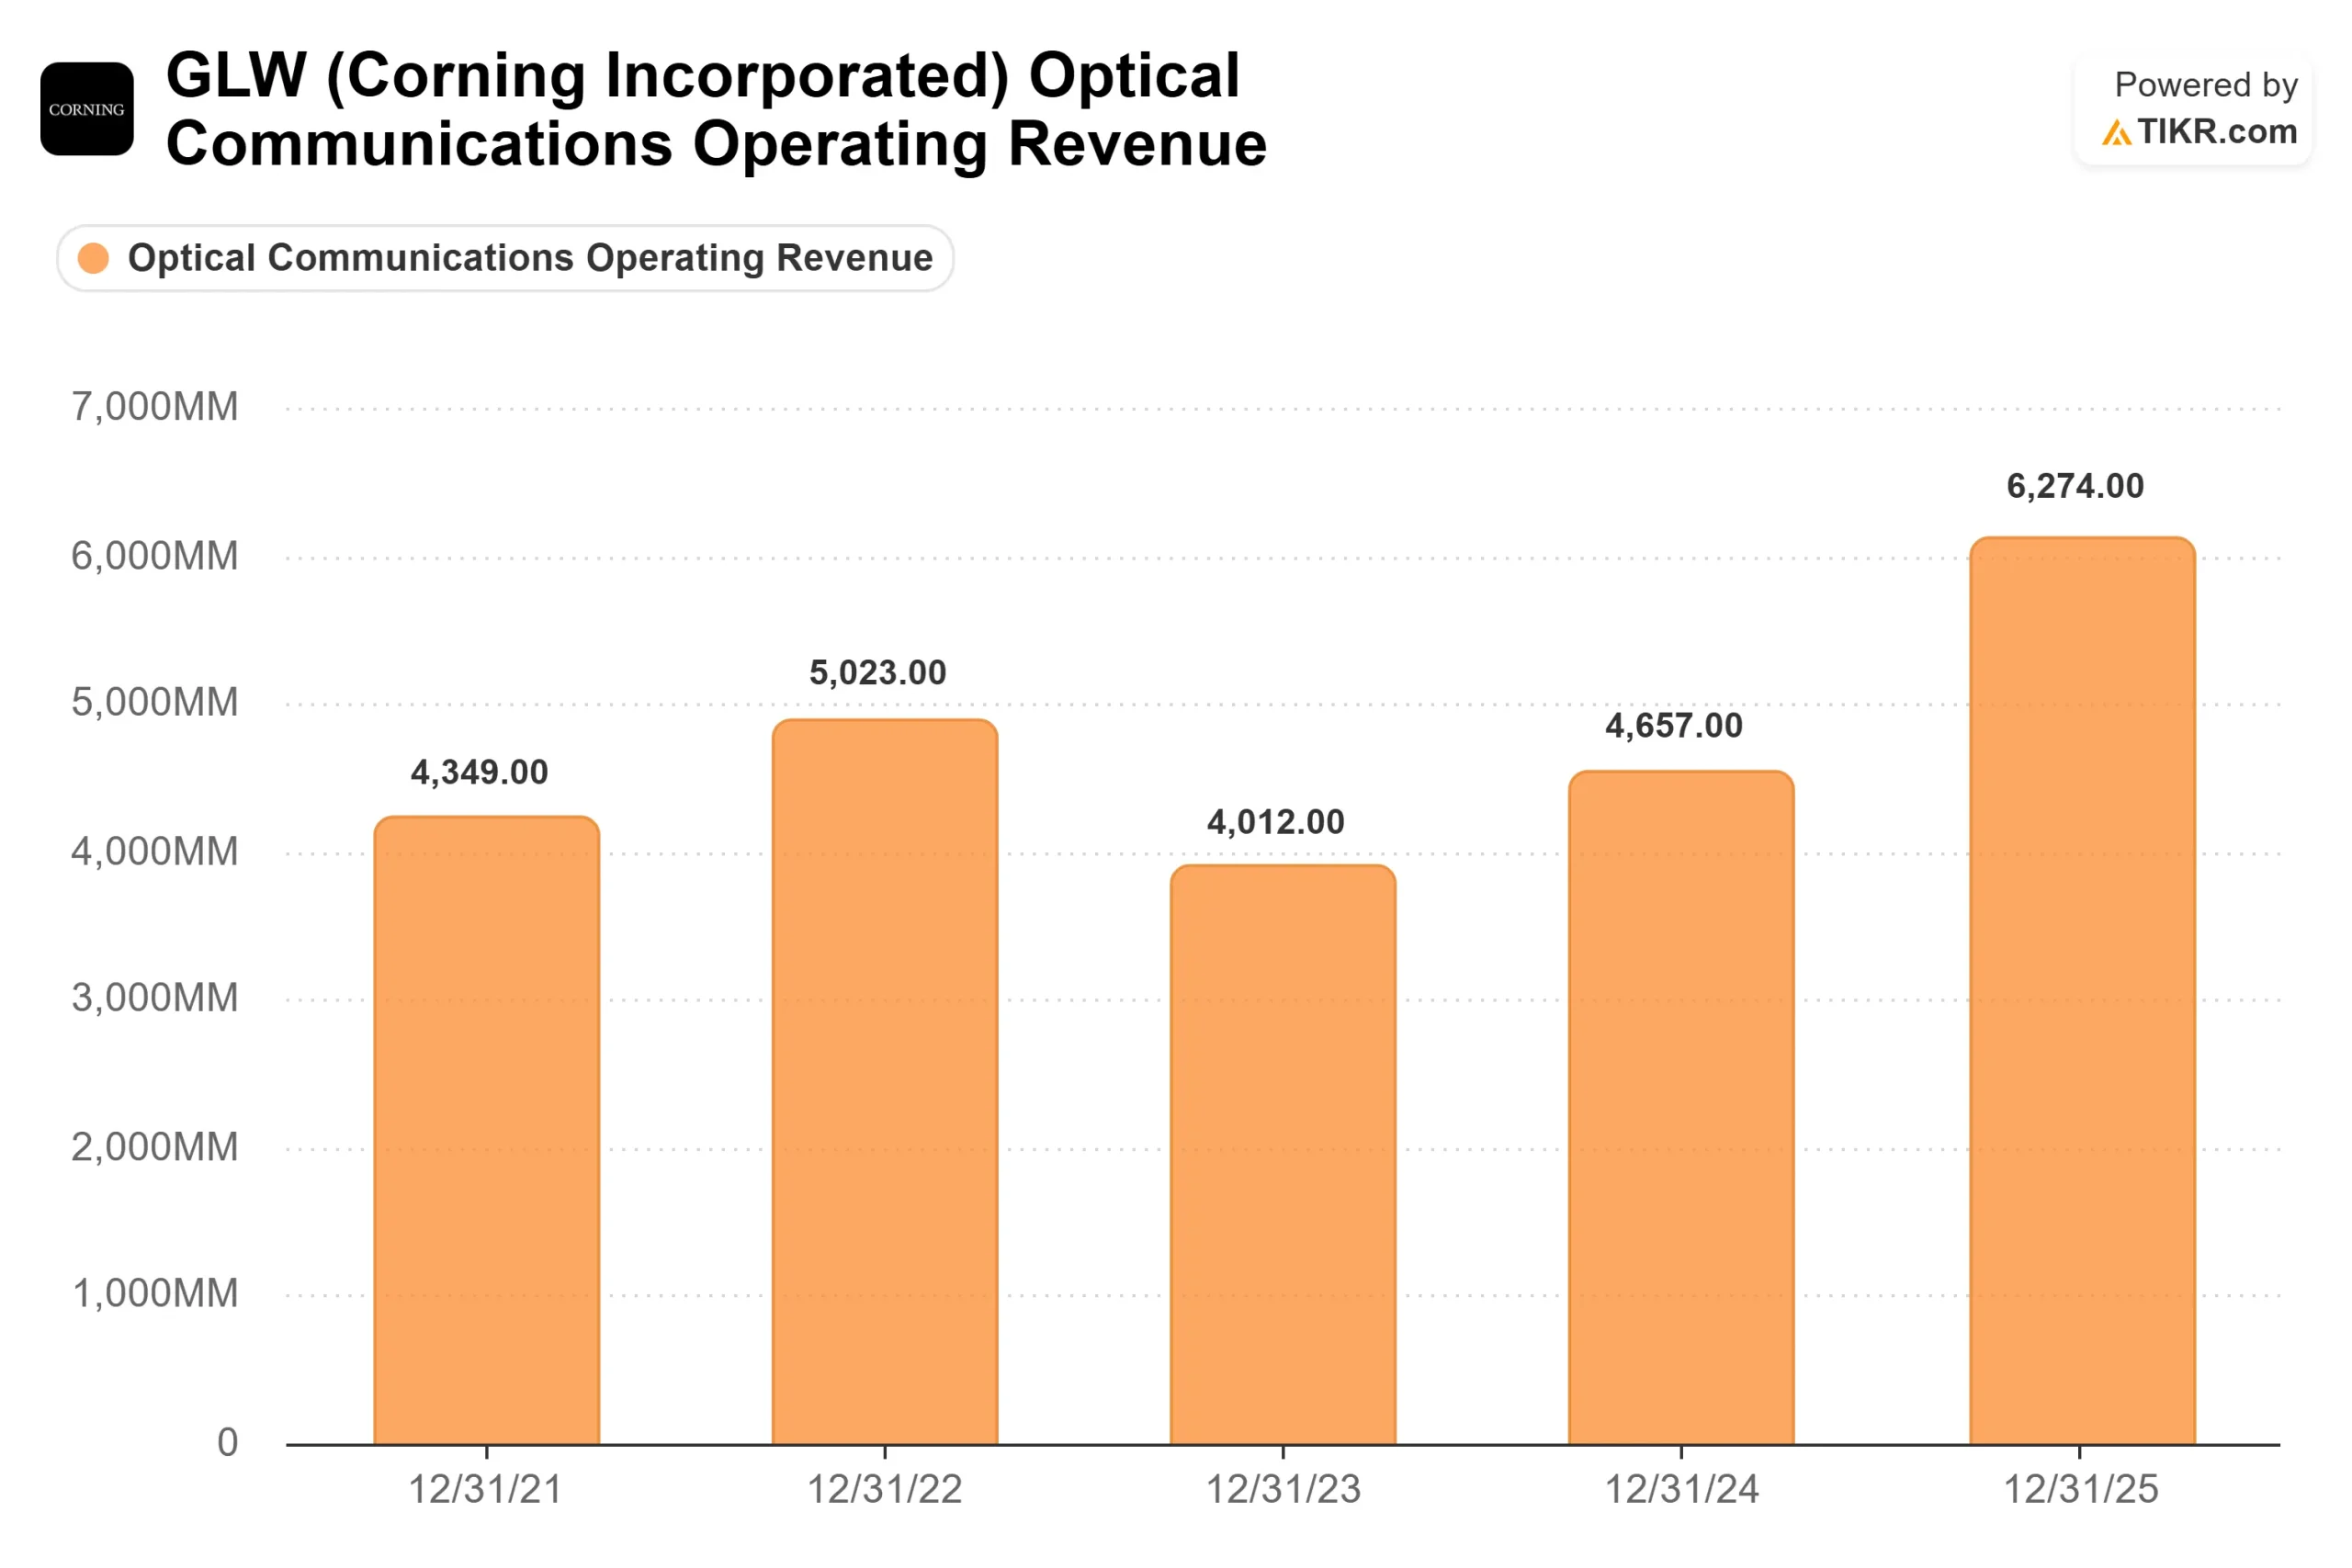 Corning Optical Communications Operating Revenue (TIKR)
See historical and forward estimates for Corning stock (It’s free!) >>>
The $40 Billion Plan Behind the Rally
One number anchors the rally: $40 billion in revenue by the end of 2030.
Corning calls its growth framework Springboard, a plan to fill the capacity it had already built and let volume flow through to margins. It has worked faster than expected. Schlesinger said operating margin moved from around 16% to roughly 20%, “a lot earlier than we expected.” At the May investor event, management extended the runway to a roughly $30 billion sales run rate by 2028 and $40 billion by the end of 2030.
The main driver is the enterprise business, which sells passive optics into data centers. Management expects it to grow at about 1.5 times the rate of GPU growth over the next few years. That multiplier matters. As clusters scale past 130,000 GPUs, the network adds a third switching layer. As COO Hal Nelson put it, “we would grow 50% more when you see cluster size that go greater than 130,000.” More chips mean disproportionately more fiber.
A second leg is photonics, the use of light rather than copper to move data inside the server. Corning laid out a $10 billion opportunity by 2030, with revenue starting in 2027. Schlesinger was candid that the timing is uncertain: “there’s definitely a lot of variability around that photonics opportunity.” Management took some sales out of its 2028 and 2030 numbers to account for it, which means the plan could prove conservative if the shift moves faster.
What the Bears See
The same data that excites bulls makes the valuation hard to ignore. Corning trades at 93.8x trailing earnings and around 58x forward earnings, well above its history. Its free cash flow base is thin against that price, with last-twelve-month levered free cash flow of about $744 million versus a market cap near $168 billion.
There are near-term cracks. Second-quarter revenue guidance of roughly $4.6 billion landed below the Street’s roughly $4.67 billion estimate, raising the worry that AI contracts are masking softness in consumer electronics and other non-optical segments. An extended maintenance shutdown at the new solar wafer plant adds about $30 million in second-quarter operating expense. And mid-June SEC filings show executives sold roughly 160,000 shares worth more than $30 million, with no offsetting buying.
None of these is fatal alone. Together, they explain the volatility around the rally. Corning now trades on expectations, and expectations are fragile.
How Corning Compares to Peers
Corning’s premium is visible against its industry. On NTM EV/EBITDA, which strips out capital structure to compare operating value, Corning trades at 31.53x. Optical peer Coherent sits slightly higher at 34.88x, while Novanta trades at 21.35x and IPG Photonics at 23.11x. The peer median is closer to 21x.
So Corning carries a clear premium to most of its industry, though not to its closest optics peer. The case rests on revenue visibility: Coherent and the others do not have $6 billion Meta commitments and NVIDIA prepayments underwriting their next five years. Whether that justifies a near-50% premium to the median is the judgment each investor has to make. The premium is real. That does not automatically make it wrong.
 Corning NTM EV/EBITDA (TIKR)
See how Corning performs against its peers in TIKR (It’s free!) >>>
TIKR Advanced Model Analysis
- Current Price: $194.92
- Target Price (Mid): ~$347
- Potential Total Return: ~78%
- Annualized IRR: ~14% / year
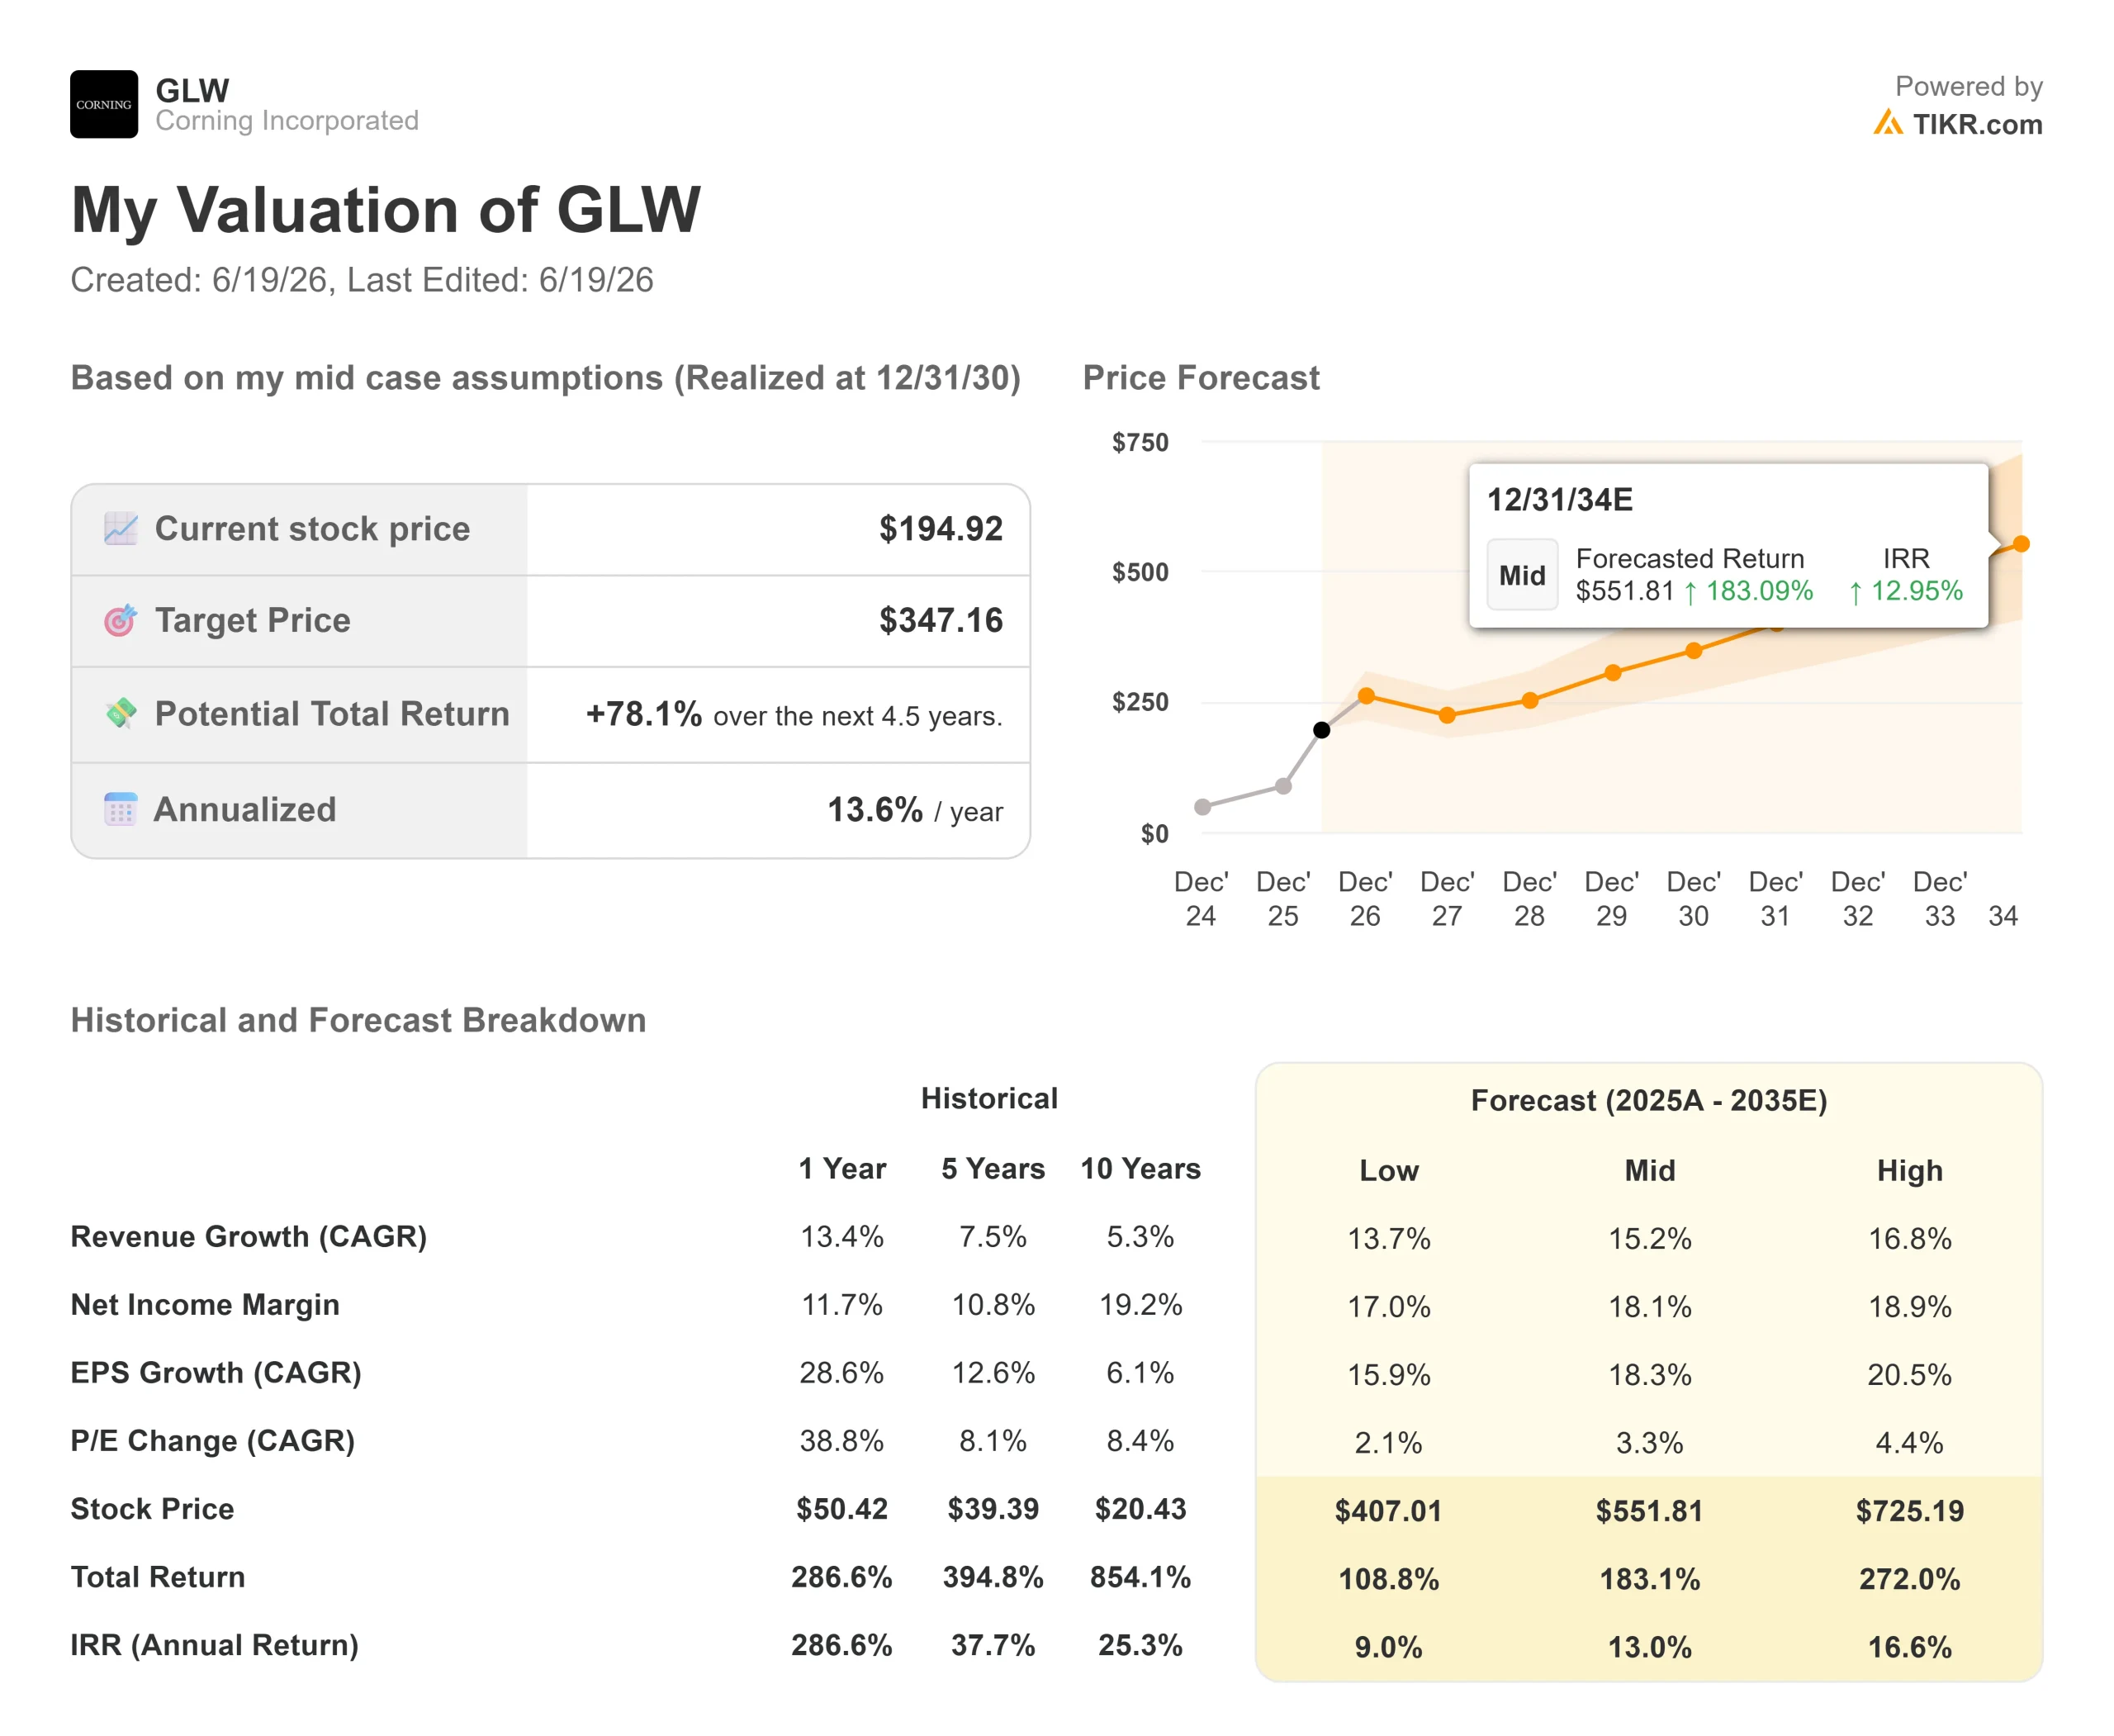 Corning Advanced Valuation Model (TIKR)
See analysts’ growth forecasts and price targets for Corning stock (It’s free!) >>>
This uses the mid case because it reflects management’s stated trajectory without assuming the most aggressive photonics ramp. Two drivers carry the revenue CAGR of around 15%: enterprise optical demand growing faster than GPU shipments, and the carrier business pulled along by data center interconnect and fiber-to-the-home. The margin driver is mixed, as higher-value optical products and better utilization lift net income margin to around 18%. The primary risk is photonics timing, which management itself flagged as uncertain.
The upside: the supply chain shifts to optical faster than planned, and Corning’s prepaid, contracted capacity captures it.
The downside: AI capital spending cools, legacy demand softens, and a 94x multiple compresses hard.
Conclusion
The cleanest test arrives with second-quarter earnings, expected in late July. Watch the Optical Communications growth rate. It grew 36% in the first quarter, and the whole story depends on it holding near that pace. A print in the low-to-mid 30s confirms the contracts are converting on schedule. A clear deceleration, paired with continued non-optical softness, would signal that the June surge ran ahead of the fundamentals.
The deals are signed, and the prepayments are real. What remains unproven is whether revenue arrives fast enough to grow into a price that already assumes it will.
See what stocks billionaire investors are buying so you can follow the smart money with TIKR.
Should You Invest in Corning?
The only way to really know is to look at the numbers yourself. TIKR gives you free access to the same institutional-quality financial data that professional analysts use to answer exactly that question.
Pull up Corning, and you’ll see years of historical financials, what Wall Street analysts expect for revenue and earnings in the quarters ahead, how valuation multiples have moved over time, and whether price targets are trending up or down.
You can build a free watchlist to track Corning alongside every other stock on your radar. No credit card required. Just the data you need to decide for yourself.
Analyze Corning on TIKR Free →
Looking for New Opportunities?
- See what stocks billionaire investors are buying so you can follow the smart money.
- Analyze stocks in as little as 5 minutes with TIKR’s all-in-one, easy-to-use platform.
- The more rocks you overturn… the more opportunities you’ll uncover. Search 100K+ global stocks, global top investor holdings, and more with TIKR.
Disclaimer:
Please note that the articles on TIKR are not intended to serve as investment or financial advice from TIKR or our content team, nor are they recommendations to buy or sell any stocks. We create our content based on TIKR Terminal’s investment data and analysts’ estimates. Our analysis might not include recent company news or important updates. TIKR has no position in any stocks mentioned. Thank you for reading, and happy investing!


You May Also Like

Daily XRP transfer volume surpasses 500 million! What does this mean during the latest price drop?

Ethereum koers toont zeldzaam dubbel koopsignaal en richt zich op $4.550

UK Gilt Yields Spike As Burnham Win Opens Door To Oust Starmer


