

Amazon Stock Down 10%: Can Bulls Reclaim the $248–$250 Zone?

Amazon stock is caught in a tug-of-war. The daily chart shows the stock has slipped below key moving averages with real downside momentum. Yet intraday buyers are stepping back in tentatively. The daily bias remains cautious — the burden of proof sits firmly with the bulls.
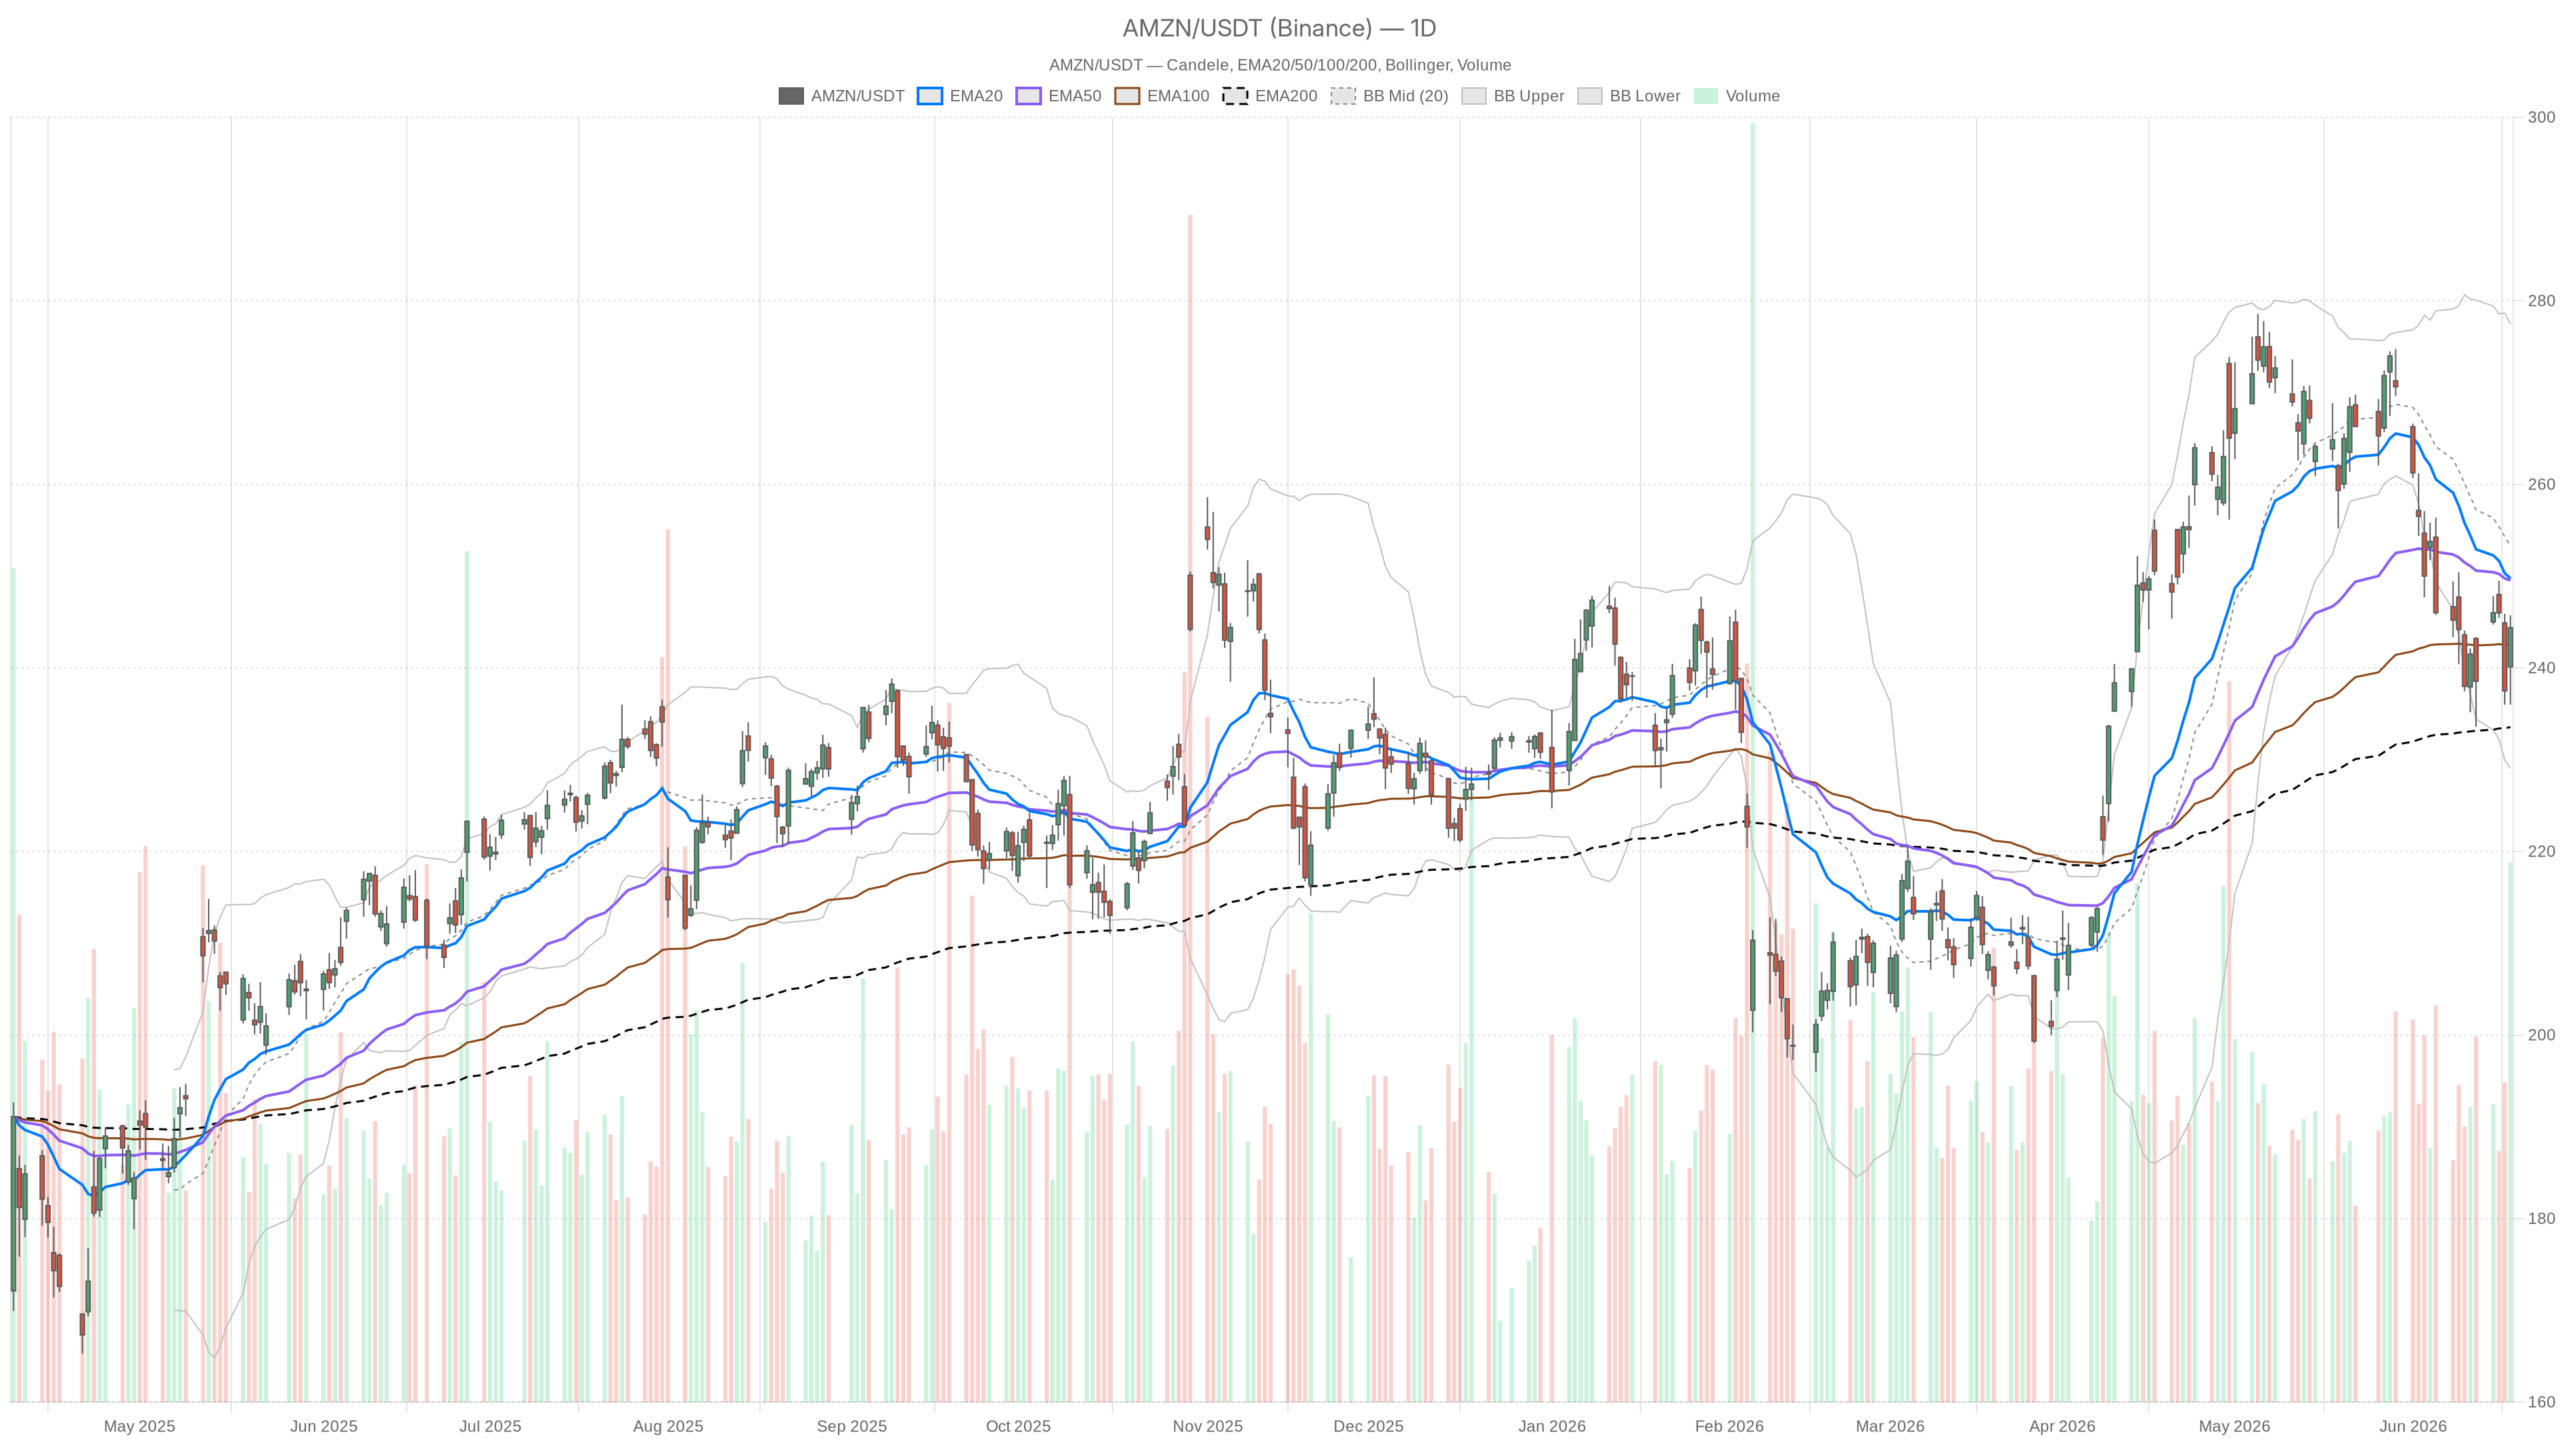 AMZN — daily chart with candlesticks, EMA20/EMA50 and volume.
Key takeaways
- AMZN closed at $244.39 on June 18, trading below both the 20-day EMA ($249.76) and 50-day EMA ($249.55).
- Daily RSI at 44.03 and a deeply negative MACD confirm active selling pressure with room to fall further.
- The 1H chart shows an intraday recovery with RSI at 55.16 and MACD crossing above its signal line.
- The $248–$250 zone is the critical resistance cluster; the 200-day EMA at $233.55 anchors macro support.
- How AMZN handles the $245–$250 battleground will determine whether this is a buying opportunity or a deeper correction.
Daily Timeframe: The Dominant Bearish Lean
The daily chart points to a bearish-leaning structure for Amazon stock. AMZN is trading below both its 20-day EMA and 50-day EMA, while momentum indicators confirm ongoing selling pressure rather than a temporary pause.
EMA Structure Confirms Distribution
On the daily chart, AMZN closed at $244.39 on June 18, printing a session range of $236.02 to $245.73. However, both the 20-day EMA at $249.76 and the 50-day EMA at $249.55 sit above the current price. Trading beneath two key medium-term averages normally confirms a distribution phase rather than accumulation.
The one constructive anchor is the 200-day EMA at $233.55. Price remains comfortably above that longer-term trend baseline. This gap provides a cushion and keeps the macro trend from turning outright negative. Still, the daily regime is neutral with a bearish tilt given the EMA structure.
Momentum Indicators Flash Continuation
Daily RSI sits at 44.03 — below the 50 midline. This confirms momentum is running weaker without yet being oversold. There is room to fall further before the RSI would signal exhaustion or a bounce condition.
Meanwhile, the MACD paints an even clearer warning. The line at -4.89 sits well below the signal line at -3.48. The histogram has extended further negative to -1.41. That configuration reflects active, ongoing selling pressure — not a pause, but a continuation.
Bollinger Bands and Pivot Map
Bollinger Bands place the daily midline at $253.28, well above the current price. AMZN is trading in the lower half of its channel, between the midline and the lower band at $229.08. This positioning reflects a stock under pressure but not yet at a statistical extreme. The ATR of $8.23 confirms daily swings remain wide.
Pivot levels provide the clearest near-term map. The daily pivot point stands at $242.05, with R1 at $248.07 and S1 at $238.36. The June 18 close above the pivot is a mild positive. However, the stock must clear $248–$250 to genuinely challenge the EMA resistance cluster above.
Hourly Timeframe: A Short-Term Recovery in Progress
The hourly chart shows a meaningful shift: Amazon stock is staging a genuine intraday recovery. AMZN now trades above both the 20-hour EMA and 50-hour EMA, with momentum indicators turning constructive.
Intraday Momentum Shift
Zooming into the one-hour chart, AMZN closed the 15:30 candle at $244.35. It sits above the 20-hour EMA at $242.57 and the 50-hour EMA at $243.59. That marks a notable change from the daily structure. Intraday buyers have been gaining the upper hand in recent sessions.
The 1H RSI at 55.16 confirms this shift, reading above the 50 neutral threshold. At the same time, the 1H MACD is turning constructive. The MACD line at 0.03 has crossed above the signal line at -0.28. The histogram has flipped positive to 0.30 — an early but real sign of fading selling pressure.
Resistance Convergence at $248–$250
In contrast, the 1H 200-period EMA at $252.46 remains a significant overhead barrier. This longer-term hourly average aligns almost precisely with the daily EMA cluster near $249–$250. That zone represents a convergence of resistance requiring genuine buying conviction to break through.
The 1H Bollinger midline now sits at $242.91, and price is trading above it. This shift from below to above the midline often signals short-term trend improvement. The 1H ATR of $2.49 confirms intraday ranges remain active enough for meaningful movement.
15-Minute Chart: Tactical Confirmation for Intraday Traders
The 15-minute chart offers tactical confirmation for short-term traders. Amazon stock shows a clean bullish alignment with price above all three EMAs. However, this strength operates within the constraints of the larger daily bearish structure.
As of the 15:45 candle, AMZN was trading at $244.35. It sits above the 20-EMA at $242.95, the 50-EMA at $242.41, and the 200-EMA at $243.05. That tight EMA cluster with price above all of them reflects a clean short-term bullish alignment.
The 15m RSI at 61.55 is elevated but not overbought. It supports a continued short-term bid without signaling exhaustion. However, the 15m MACD histogram at -0.06 shows the signal almost flat. Short-term momentum is stalling right at current levels.
The 15m pivot R1 at $245.15 is the immediate ceiling. A clean break above that level would open the door toward the $248 area on an intraday basis. Overall, the 15m setup is constructive for timing entries. It does not, however, resolve the medium-term overhang.
The Narrative Behind the Chart: AWS, AI, and a Valuation Debate
The technical picture in Amazon stock does not exist in isolation. The market debate centers on whether the recent 10% pullback represents a buying opportunity or the early phase of a deeper correction.
On the fundamental side, bulls point to AWS reacceleration and extraordinary AI revenue growth. CEO Andy Jassy recently stated that AI adoption speed has no precedent. AWS’s AI revenue run rate has exceeded $15 billion — a scale reached with remarkable speed. That narrative supports a constructive medium-to-long-term view for earnings power.
At the same time, at least one major fund — Berkshire Hathaway under Greg Abel — appears to have trimmed Amazon exposure. The fund reportedly rotated into Alphabet instead. That institutional signal adds caution to the fundamental bull case. Free cash flow compression from aggressive AI capex is also a real near-term headwind.
Notable among recent commentary is a 12-month price target of $322.05 from 24/7 Wall St. That implies roughly 36% upside from the $237 area. Targets of that magnitude reflect genuine long-term conviction in AWS and advertising compounding. However, targets are not price catalysts — the market still needs a trigger to close that gap.
Bullish Scenario: What Would Drive a Recovery
For the bullish case to materialize, Amazon stock must recapture and hold the $248–$250 zone. That region represents a convergence of the daily 20-EMA, daily 50-EMA, and the daily R1 pivot. A sustained close above $250 would shift the stock back above both medium-term averages, changing the EMA structure meaningfully.
Supporting that move, the 1H momentum setup is already leaning constructive. A continuation of the intraday bid with expanding volume could drive daily candles with real upside follow-through. Additionally, any positive catalyst — AWS growth data or AI monetisation announcements — could accelerate the move. The 200-day EMA at $233.55 acting as a reliable support floor gives bulls a clearly defined risk anchor.
Bearish Scenario: What Would Invalidate the Bull Case
The bearish case for Amazon stock rests on the daily MACD, which remains deeply negative and does not reverse easily. If selling pressure resumes and AMZN fails to hold daily pivot support at $242.05, the next meaningful level is S1 at $238.36.
Below S1, the $233–$234 zone — near the 200-day EMA — becomes the critical test. A break of the 200-day EMA on a closing basis would be structurally significant. It would likely attract more institutional selling.
Furthermore, if the 1H recovery fades and price drops below the $243–$242 EMA cluster, the short-term bullish case evaporates quickly. The daily RSI, still at 44, has not reached levels that trigger aggressive bottom-fishing. There is room to move lower before that impulse kicks in.
Positioning, Volatility, and the Path Forward
Amazon stock is not in a crisis — but it is under real technical pressure. The daily structure remains bearish-leaning, with the stock beneath key EMA resistance, MACD sloping negative, and RSI below neutral. The intraday recovery is genuine and worth monitoring. However, it has not yet done enough to shift the dominant daily bias.
Volatility remains elevated, with a daily ATR of over $8. That environment demands respect for stop placement and position sizing. The $245–$250 zone is the defining battleground. How AMZN handles that resistance cluster will determine whether this pullback was a buying opportunity or the start of a more extended consolidation.
FAQ
Is Amazon stock in a bearish trend right now?
The daily chart shows a bearish-leaning structure, with AMZN trading below both the 20-day and 50-day EMAs. However, the 200-day EMA at $233.55 is still holding as macro support. This keeps the longer-term trend from turning outright negative.
What is the key resistance level for Amazon stock?
The $248–$250 zone is the critical resistance cluster for Amazon stock. It converges the daily 20-EMA, 50-EMA, and R1 pivot. A sustained close above $250 would signal a bullish structural shift.
What are the fundamental drivers behind the AMZN pullback?
The recent 10% pullback reflects a mix of free cash flow compression from AI capex, institutional repositioning, and a broader valuation debate. Bulls, however, point to AWS AI revenue exceeding $15 billion as a powerful long-term growth catalyst.
Is the intraday recovery in Amazon stock sustainable?
The 1H chart shows genuine recovery with RSI above 50 and MACD turning positive. However, this intraday strength has not yet overcome the daily bearish structure. Sustainability depends on clearing and holding the $248–$250 resistance zone.
Disclaimer: This article is for informational purposes only and does not constitute financial advice, an investment recommendation, or a solicitation to buy or sell any financial instrument or cryptocurrency. The analysis provided is not indicative of future results. Investing in crypto assets and financial markets carries a high risk of capital loss. Always do your own research (DYOR) and consult a qualified financial advisor before making any decision.
Article produced with the assistance of artificial intelligence and reviewed by the editorial team.


You May Also Like

Namibia rejects Starlink’s appeal, leaving Elon Musk’s satellite service locked out of 2 major African markets

Best Crypto to Buy Right Now: Pepecoin Holders Diversify Into AI as MemeToro $MT Emerges as the Top AI Coin of 2026

OKX taps Andrew Cuomo for bold NYSE tokenization venture


Trending News
More24/7 Live News
MoreQuick Reads
More
