

Ripple Price Sinks to $1.10 — Is a Drop Below $1 Next?

As of late June 2026, XRP continues grinding lower without any real attempt at recovery. The Ripple price sits at $1.10 as of the June 23 data snapshot, and every timeframe confirms sellers remain in control while buyers stay absent.
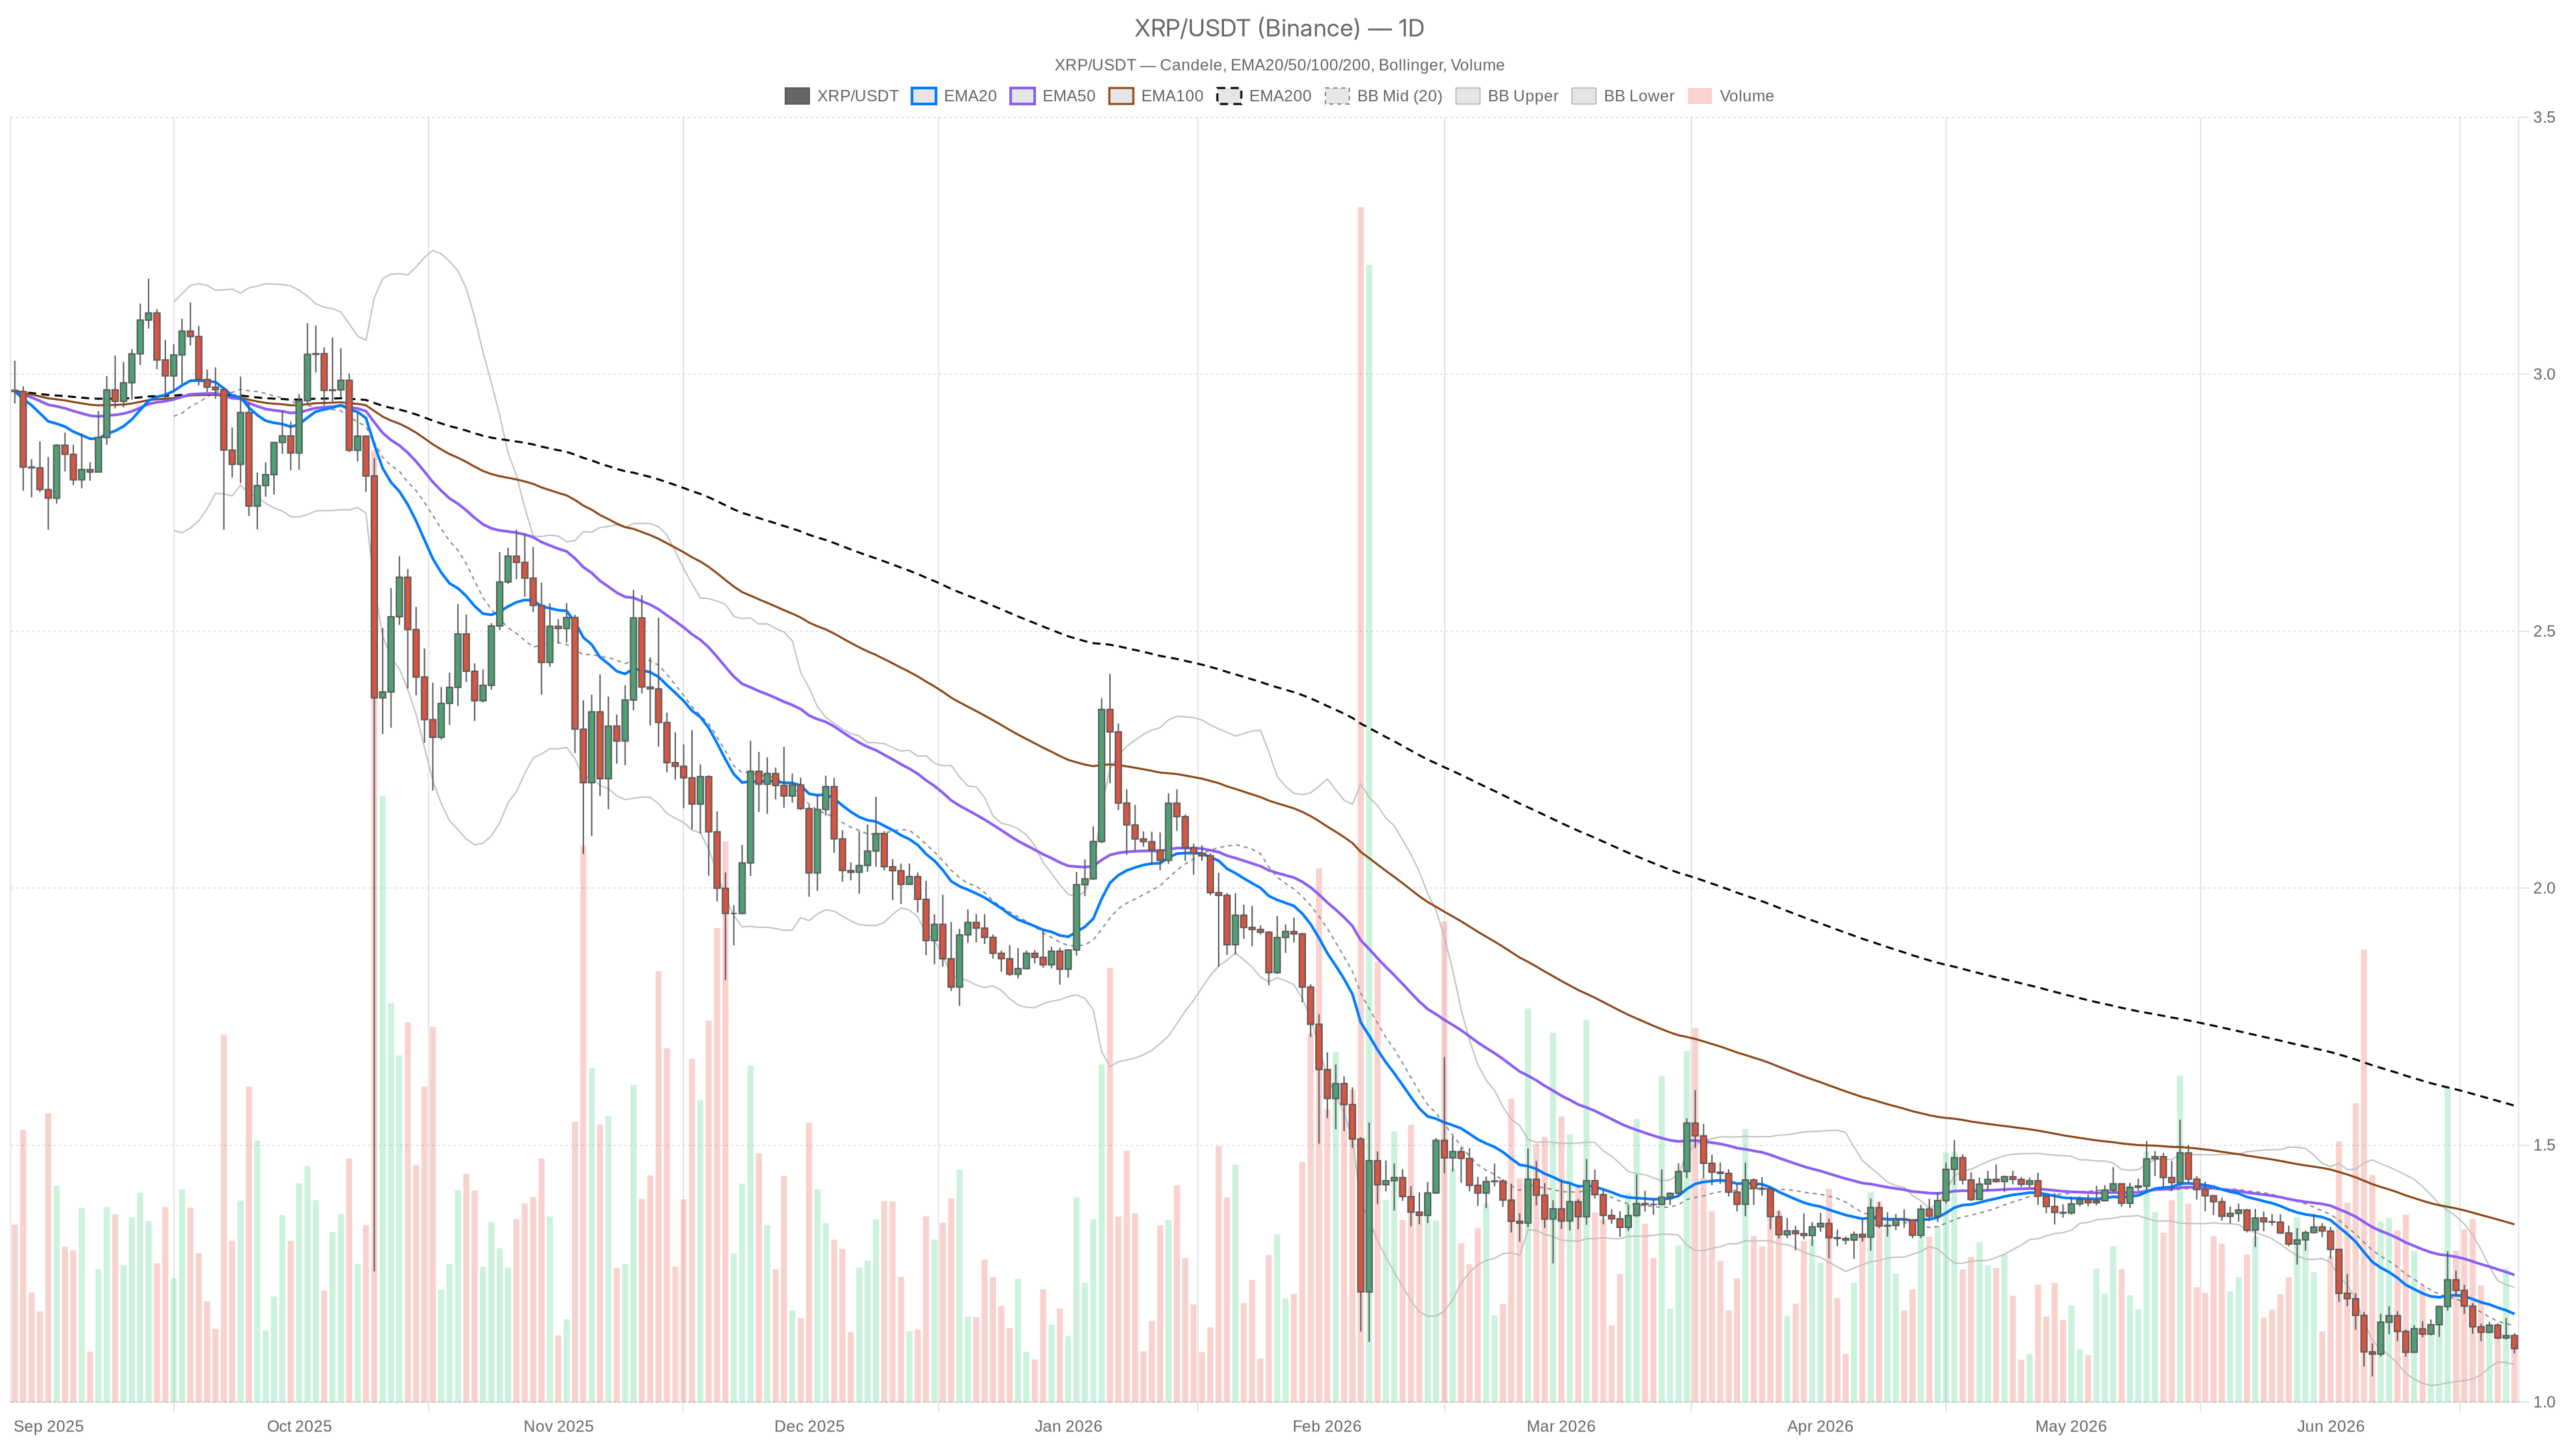 XRP/USDT — daily chart with candlesticks, EMA20/EMA50 and volume.
Key takeaways
- XRP trades at $1.10, sitting below all major daily EMAs — including the EMA200 at $1.58 — confirming a firmly bearish macro structure.
- Daily RSI at 36.79 indicates there is still room to fall before oversold conditions force any meaningful bounce.
- The Fear & Greed Index at 23 signals Extreme Fear, creating a risk-off environment where altcoins consistently underperform.
- A daily close below $1.09 opens the path toward $1.07 and potentially the psychological $0.95–$1.00 zone.
- Any credible bullish reversal requires a sustained reclaim of $1.17 (EMA20) with genuine volume behind the move.
Daily Chart: The Macro Structure Is Firmly Bearish
The daily chart leaves no room for ambiguity — XRP is locked inside a firmly bearish macro structure, and every moving average above price reinforces the downtrend. XRP closed at $1.10, sitting below its EMA20 at $1.17, EMA50 at $1.25, and critically its EMA200 at $1.58. That descending stack of EMAs represents months of failed recovery attempts compressed into a single undeniable signal.
Meanwhile, the broader crypto backdrop reinforces the weakness. Total market capitalization stands near $2.22 trillion according to CoinGecko, but it shed roughly 2.74% in the past 24 hours. Bitcoin dominance has climbed to 56.2%, signaling that capital is consolidating into the benchmark rather than rotating into altcoins. The Fear & Greed Index at 23 remains locked deep in Extreme Fear territory.
The daily RSI at 36.79 hovers near oversold territory without breaking below the 30 threshold. That nuanced reading means there is still room to deteriorate before the market technically demands a bounce. Historically, assets can spend considerable time in the 30–40 RSI zone during sustained downtrends without snapping back. MACD at -0.04 shows both the signal line and MACD line parked with a flat histogram — zero divergence, zero momentum, just dead air. That kind of compression after a leg down often resolves with continuation rather than reversal.
Bollinger Bands frame price between a lower band at $1.07 and an upper band at $1.22, with the midline at $1.15. At $1.10, XRP is pressing into the lower half of the range. The midline sits above current price, meaning any attempt to reclaim $1.15 must first break through the band’s gravitational midpoint. The ATR of $0.05 daily confirms this is not a wildly swinging asset. It is a slow bleed, which arguably makes it harder to trade than a sharp breakdown.
Daily pivot analysis places the pivot point at $1.11, with R1 at $1.13 and S1 at $1.09. Price hovers just below the pivot, making the $1.09–$1.10 zone a genuinely critical area. A daily close below $1.09 shifts focus to the Bollinger lower band at $1.07. Below that level, the chart gets structurally thin.
Hourly Chart: No Stabilization, Just Compression
The hourly timeframe offers no relief — instead, it shows oversold conditions that might trigger a short-term bounce but are unlikely to reverse the dominant downtrend. The hourly RSI has collapsed to 29.43, which is technically oversold and does create mechanical conditions for a bounce. However, oversold on the hourly inside a daily downtrend is a warning light, not a buy signal. The short-term selling has been aggressive, but it does not override the larger structure.
The hourly EMA stack mirrors the daily in miniature. Price at $1.10 sits below the EMA20 at $1.12, EMA50 at $1.13, and EMA200 at $1.15. That full bear stack compressed into a tight range reflects a market trending down long enough for short-term averages to catch up with long-term ones.
Hourly MACD is flat at -0.01 with no histogram divergence. Moreover, the Bollinger Bands have tightened dramatically, with the upper band at $1.15 and the lower at $1.10 — price is sitting right at the floor. A close below $1.10 on the hourly would represent a genuine breakdown and would likely trigger a flush toward $1.07–$1.08.
15-Minute Chart: The Execution Layer
The 15-minute chart tells the same story in compressed form: bearish regime, price at $1.10, and all EMAs stacked above at $1.11, $1.12, and $1.13. The RSI at 37.94 has bounced fractionally from the hourly oversold reading, signaling possible short-term consolidation. However, the Bollinger Bands have narrowed to almost nothing — upper at $1.12, lower at $1.10 — and the ATR is effectively zero. This kind of squeeze often precedes a directional move. Given the broader context across every timeframe, the odds favor a downside resolution.
The Bullish Case: What Would Need to Happen
A credible bullish reversal is not yet visible on the chart, but the conditions required for one can be clearly defined. The most important near-term trigger would be a sustained hold above $1.11 — the daily pivot — followed by a reclaim of the Bollinger midband at $1.15. That combination would neutralize immediate sell pressure and open the door toward the EMA20 at $1.17.
Above that, $1.22 and then $1.25 would come into play for any developing recovery. The hourly RSI near 29 provides mechanical fuel for this kind of bounce, and sometimes that alone can ignite a short squeeze if broader sentiment shifts. However, the invalidation point is unambiguous: any daily close below $1.07 would effectively end the conversation about near-term recovery.
The Bearish Case: What the Chart Is Already Saying
In contrast, the bearish case requires no imagination — it is the default reading across every timeframe and the path of least resistance remains firmly lower. A close below $1.09 reopens the path toward $1.07. Below that, the chart has very little structure until the $0.95–$1.00 psychological zone. The daily MACD shows no sign of bottoming, and the EMA200 at $1.58 feels increasingly remote.
Furthermore, the Fear & Greed reading of 23 suggests retail capitulation has not fully run its course. In this environment, rallies get sold rather than bought. The bearish case only gets invalidated if price reclaims $1.17 on a daily close with genuine volume. Anything short of that remains noise inside a structured downtrend.
Positioning and Risk Context
The Ripple price at $1.10 leaves traders facing an uncomfortable asymmetry of risk. The potential bounce from oversold hourly conditions is real but likely shallow — the kind of move that traps late buyers before the downtrend resumes. Anyone already short from higher levels faces the question of whether the hourly oversold condition warrants partial profit-taking. That decision depends on their entry level and broader market behavior over the next 24 hours.
The $1.09–$1.11 band is the defining zone where pivots converge and Bollinger lower bands cluster. A clean breakdown through it changes the calculus entirely. Volatility is currently compressed — ATR remains thin across all timeframes — which means when it expands again, the move will likely feel disproportionate to recent price action. Consequently, in a market trading at Extreme Fear, that expansion tends to happen to the downside first.
FAQ
What is driving the Ripple price decline in June 2026?
The decline stems from a combination of technical weakness and macro headwinds. XRP sits below all major moving averages on the daily chart, with the EMA200 at $1.58 far above current price. Meanwhile, Bitcoin dominance has risen to 56.2%, the Fear & Greed Index sits at 23, and the broader crypto market is shedding value — all conditions that punish altcoins disproportionately.
Where are the next support levels if XRP breaks below $1.10?
Immediate support sits at the daily S1 level of $1.09, followed by the Bollinger lower band at $1.07. Below that, the chart offers little structural support until the psychological zone between $0.95 and $1.00. A daily close below $1.07 would confirm a breakdown and shift focus to that lower range.
Can XRP stage a recovery from this bearish structure?
A recovery is possible but requires specific triggers. The first step is a sustained hold above the daily pivot at $1.11, followed by reclaiming the Bollinger midband at $1.15. From there, the EMA20 at $1.17 becomes the first genuine resistance test. Without reclaiming $1.17 on a daily close with volume, any bounce remains corrective within the broader downtrend.
What role does the Fear & Greed Index play in the XRP outlook?
At 23 — deep in Extreme Fear territory — the index signals that retail sentiment is defensive and risk-averse. Historically, such readings coincide with altcoin underperformance as capital rotates toward Bitcoin. While extreme fear can sometimes precede reversals, it more often indicates that selling pressure has not yet been exhausted.
Disclaimer: This article is for informational purposes only and does not constitute financial advice, an investment recommendation, or a solicitation to buy or sell any financial instrument or cryptocurrency. The analysis provided is not indicative of future results. Investing in crypto assets and financial markets carries a high risk of capital loss. Always do your own research (DYOR) and consult a qualified financial advisor before making any decision.
Article produced with the assistance of artificial intelligence and reviewed by the editorial team.


You May Also Like

Chainlink joined European and South Korean banks to explore stablecoin settlements in new cross-border project

Reading Whale Behavior Through On-Chain Supply Data

LIST: Bayanihan initiatives amid soaring oil prices


