

Solana (SOL) Price Analysis: Can SOL Recover After Touching 3-Year Lows?
TLDR
- SOL has recovered from the $60 support level and currently trades in the $64–$69 corridor, though it sits below crucial exponential moving averages
- Bearish signals dominate derivatives markets: the long-to-short ratio declined to 0.94 while funding rates entered negative territory
- SOL has recorded eight straight monthly losses, representing the longest losing streak in the token’s trading history
- Technical analyst BATMAN identified SOL caught within a symmetrical wedge pattern displaying bearish MACD divergence beneath the 200 EMA around $74
- Despite market challenges, spot Solana ETFs attracted $137,290 in net capital inflows on Tuesday, indicating persistent institutional participation
Solana has managed to defend the critical $60 threshold, though the subsequent rebound appears tentative. Currently trading near $69, the token remains constrained beneath important moving averages while confronting multiple resistance barriers.
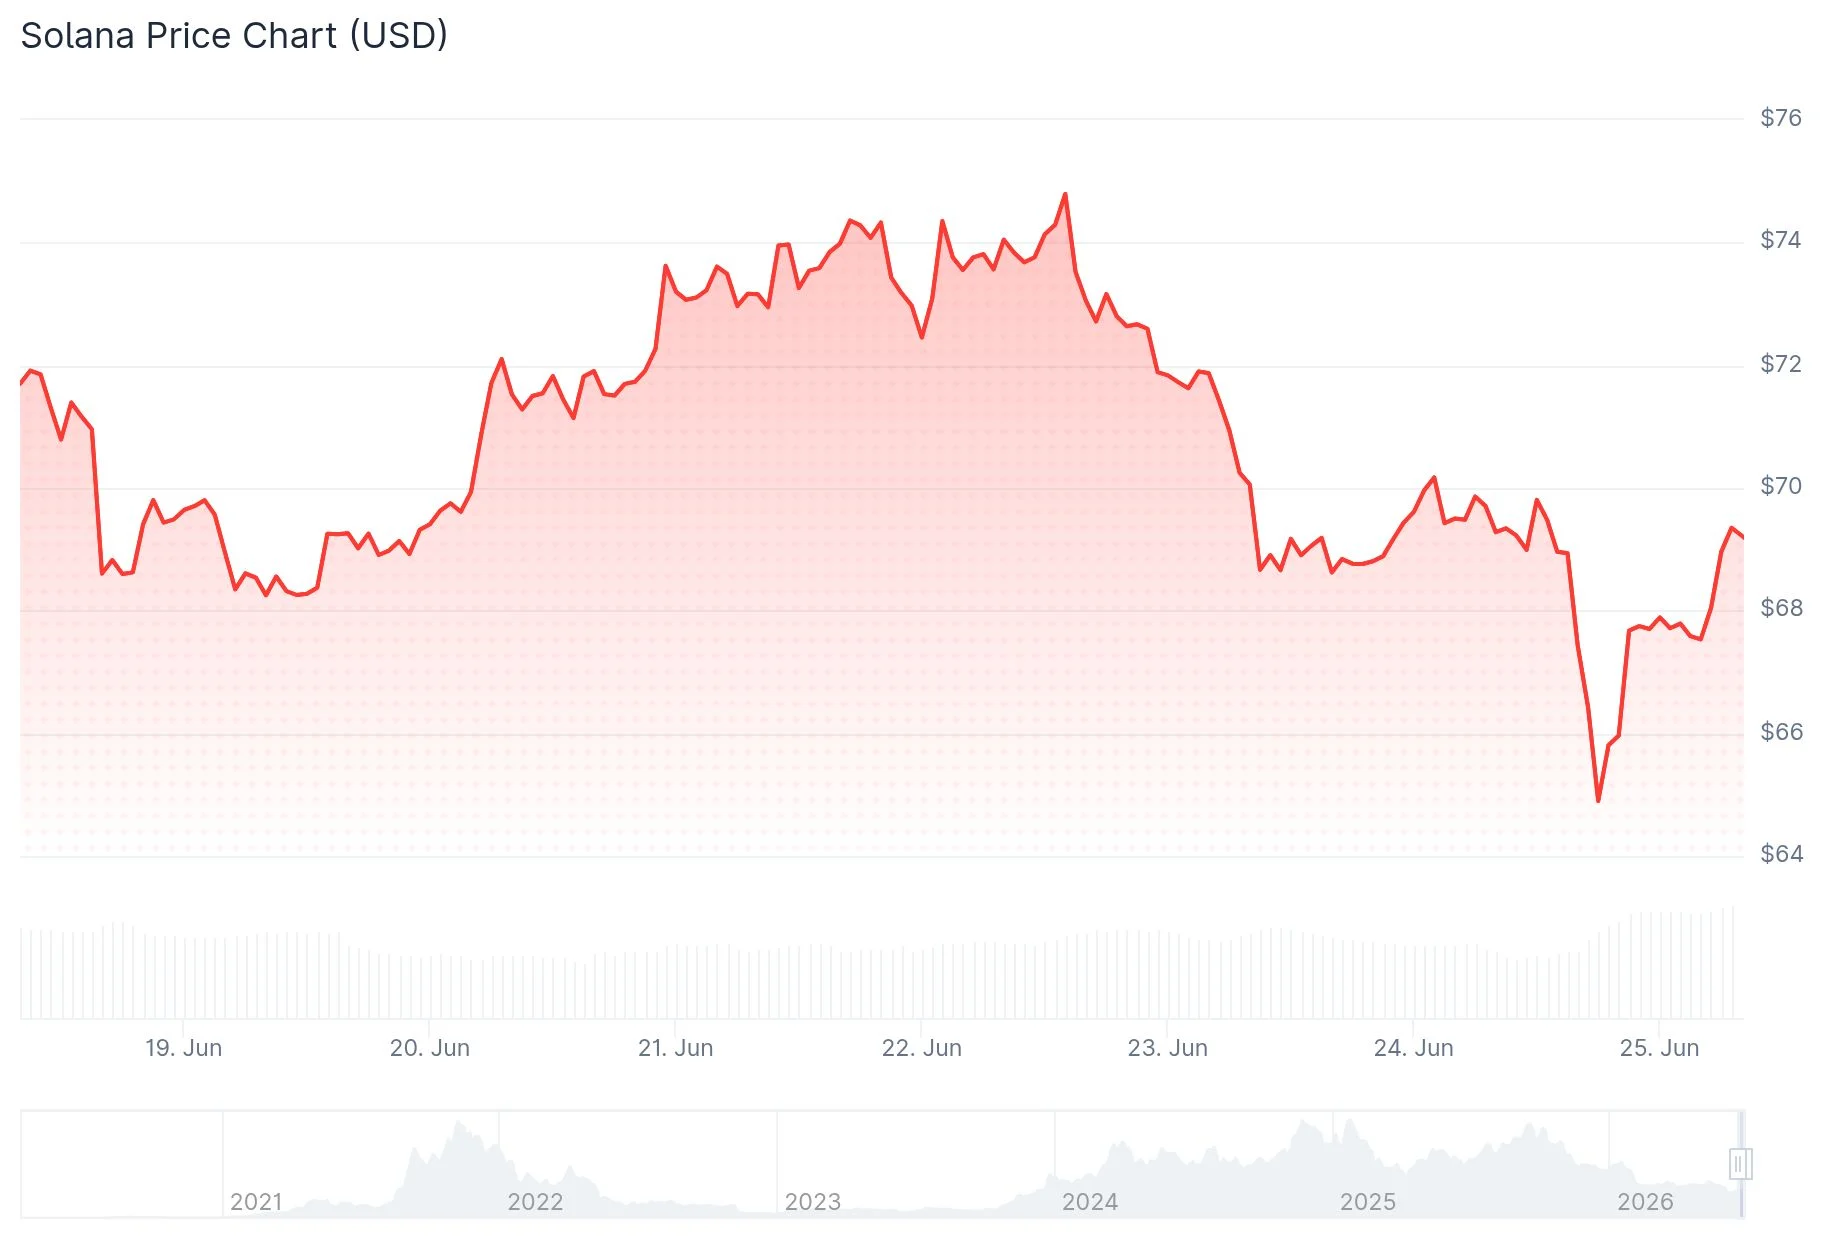 Solana (SOL) Price
The $60 region has emerged as a significant psychological floor. Demand materialized at this level, propelling SOL upward by more than 5% over a 24-hour period at its peak. However, selling pressure continues to mount at higher price points.
Derivatives market indicators paint a cautious picture. According to CoinGlass data, Solana’s long-to-short ratio slipped to 0.94 on Wednesday. This sub-1.0 reading indicates short positions have overtaken long positions, reflecting pessimistic trader sentiment.
Funding rates also flipped negative during the early week period, registering -0.0080% on Wednesday. This configuration means short sellers are compensating long holders, a dynamic that generally suggests market participants anticipate further price deterioration.
On June 24, cryptocurrency analyst BATMAN highlighted that SOL appears confined within an expansive symmetrical wedge formation. As volatility contracts toward the pattern’s convergence point, price action continues struggling beneath the 200 EMA positioned near $74. The MACD indicator displays bearish divergence alongside waning momentum. BATMAN emphasized that Solana is “running out of room” and questioned whether SOL would breach the $69 level.
Critical Resistance Zones Ahead
SOL currently trades beneath its 50-day, 100-day, and 200-day exponential moving averages. This creates a layered resistance structure that bulls must overcome to establish meaningful upside momentum.
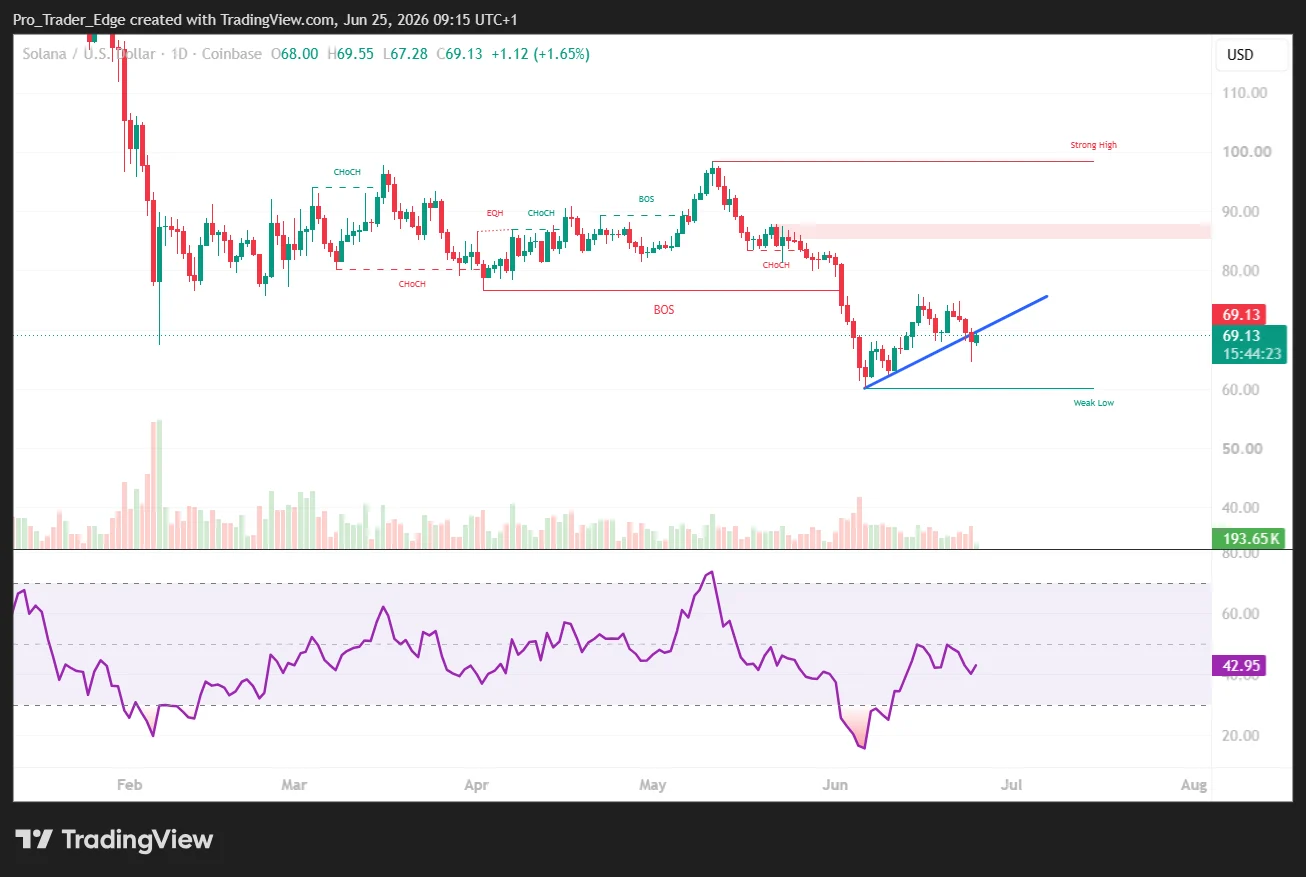 Source: TradingView
The initial obstacle appears around $74.75. Beyond that lies the 50-day EMA positioned near $76.18. A more substantial advance could challenge the 50% Fibonacci retracement level at $79.27, followed by the 100-day EMA at $83.03.
The MACD on the 4-hour timeframe shows signs of consolidation, while the RSI hovers around 46, remaining below the neutral 50 threshold. Neither technical indicator suggests imminent bullish momentum from present price levels.
The monthly chart reveals particularly concerning dynamics. Analyst Ash Crypto highlighted that SOL has now produced eight consecutive red monthly candles, an unprecedented occurrence throughout its trading existence. The monthly RSI has reached more oversold territory than during the 2022 FTX crisis, when SOL plummeted to approximately $8.
Emerging Support Indicators
Not all market signals lean bearish. According to SoSoValue data, spot Solana ETFs registered $137,290 in net capital inflows on Tuesday. While this represents a relatively small amount, it demonstrates ongoing institutional appetite.
Several market observers are monitoring the $50–$40 range as a potential accumulation territory. Rod’s technical framework suggests that if SOL establishes a foundation within this zone, a prolonged recovery trajectory toward $175 could materialize. Meanwhile, Trader Symba’s SOL/BTC pair analysis identifies a long-term demand zone in the vicinity, projecting eventual new peaks above $300.
CryptoJack noted a trendline breakout on the 1-hour chart, suggesting immediate downward pressure may be diminishing. Essential support levels to maintain are $62–$63, with upside objectives positioned at $68, $70, and subsequently $76.
As of Wednesday, SOL’s long-to-short ratio stood at 0.94 and funding rates measured -0.0080%, with the token trading around $69.58.
The post Solana (SOL) Price Analysis: Can SOL Recover After Touching 3-Year Lows? appeared first on Blockonomi.


You May Also Like

Top U.S. economist says Gold reversal is imminent

MEV Extraction and What It Means for Price Discovery in DeFi

Xbox Hits Gamers With Price-Hike As Major Retailer Warns Console Shortage Looms Ahead Of GTA VI Launch


