

Solana (SOL) at a Crossroads: Break Higher or Slip Into Another Downtrend?
- Solana is currently hovering at $68.
- SOL exhibits a consolidating market.
With the potent bears in the crypto market, the overall sentiment has fallen into the extreme fear zone. All the major digital assets have been charted in red, losing momentum. Among the altcoins, Solana (SOL) is attempting to climb to its recent high ranges.
In the early hours, the asset traded at a bottom level of $64.42, with potential bears stepping in. Later, the Solana price moved up to a high of $70.73, tested and broken certain resistances. At the time of writing, Solana price trades within the $68.74 mark.
The asset’s market cap is staying at $39.91 billion, and the daily trading volume has increased by over 31.35%, having reaching$4.41 billion. Consequently, the SOL market has seen a liquidation of $32.19 million during the last 24 hours, as reported by the Coinglass data.
Can Solana Halt Its Current Downturn, or Will It Drop Further?
SOL’s 4-hour trading window reveals that the price could further fall toward the $68.14 support range. Additional downside correction might trigger the death cross to take place, and the bears would likely push the asset’s price lower, below $67.23.
Conversely, with a bullish reversal in momentum, the Solana price might rise and challenge the immediate resistance level at $68.99. If the golden cross emerged with the bulls gaining strength, the price could climb and touch the $69 threshold.
The technical analysis exhibits that both the Moving Average Convergence Divergence (MACD) and signal lines are below the zero line. It indicates that SOL is trading in a bearish trend. The price remains below its longer-term average.
Unless the indicators begin moving back toward the zero line, downside pressure is likely to persist. Moreover, any short-term gains are more likely to be corrective than trend-changing.
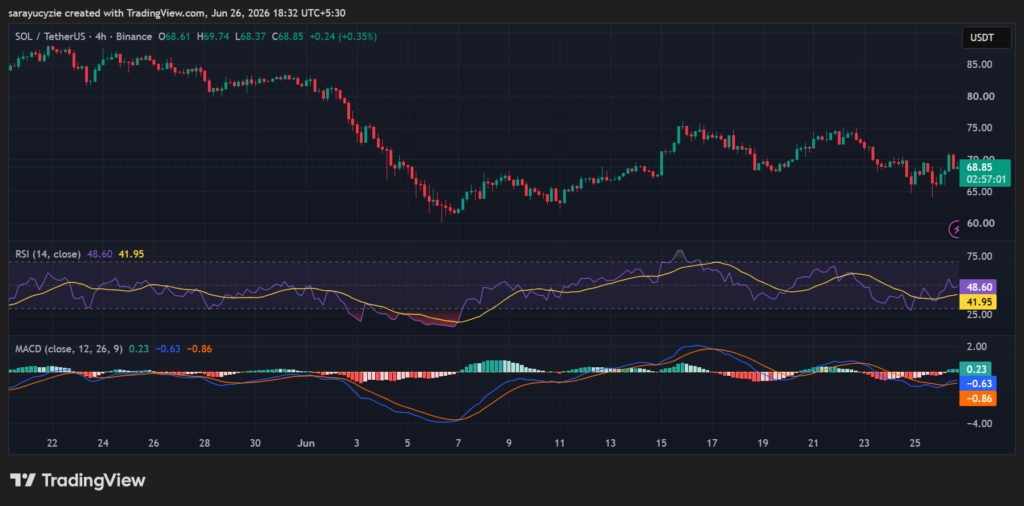 (Source: TradingView)
Solana’s daily Relative Strength Index (RSI) is settled at 48.60, suggesting neutral momentum with a slight bearish bias. As it is below the 50 midpoint, the sellers hold a marginal advantage. However, the reading remains close to neutral; neither buyers nor sellers have established strong control.
This level reflects a consolidating market, where the next directional move will depend on whether the value breaks above or below the 50 level.
Crypto Market Highlights
$3M Exploit Hits Polymarket: Users to Receive Full Refunds After Third-Party Breach


You May Also Like

BTC Price Shaky Near $67K While Oil Surges on Middle East Tensions: What's Next? (April 2 Update)

3 Reasons Investors Are Following Mutuum Finance (MUTM) Since Q1 2025

What is the Travel Rule? Crypto KYC, AML, and what exchanges must share


