

Solana (SOL) Clings to the $65–$71 Support Zone: Can Buyers Defend It?
- Buyers are trying to keep Solana above the $65–$71 support zone.
- SOL price is currently trading around the $71 mark.
Solana’s price structure continues to draw attention as the data points to one of its strongest historical support zones. According to the URPD chart, more than 60 million SOL last changed hands between $65 and $71, creating a demand area that could play a crucial role in determining the asset’s next move.
The URPD metric reveals where existing holders acquired their tokens. Notably, the price ranges with larger transaction volumes show stronger support because investors who bought there may be more inclined to defend their positions or accumulate additional tokens if prices revisit those levels.
If Solana Fails to Hold this Range, Where Does it Go Next?
As long as Solana remains above the $65–$71 region, the broader bullish market structure remains intact. However, losing this support could shift attention to lower zones where significant trading activity previously occurred.
The first major level sits near $53.10, where around 7 million SOL were transacted. If selling pressure intensifies, the next notable support appears around $23.60, backed by nearly 5 million SOL. A deeper correction could eventually test $8.85, where roughly 15 million SOL previously changed hands, making it another important accumulation zone.
For traders and long-term investors alike, the current $65–$71 range remains the most crucial area, as its ability to hold could determine whether Solana continues its upward trend or enters a broader corrective phase.
Can Solana Secure a Steady Bullish Turnaround?
Solana is currently trading at around $71.32, with its daily trading volume up by over 32.36%, reaching the $2.2 billion mark. As reported by the Coinglass data, the SOL market has experienced a liquidation of $10.42 million over the last 24 hours.
The 4-hour price chart of SOL exhibits that the price momentum is attempting to climb higher. It might move toward the immediate resistance at $71.85. If the bullish pressure gains further traction, the price could hit above $72. If the bears are encountered again in the Solana market, the support could be found at $70.81. With the downside correction maintaining the position, the asset’s price might potentially slip to a target below the $70 range.
SOL’s Moving Average Convergence Divergence (MACD) line is above the signal line, and both are above the zero line. It hints at building a strong bullish momentum. As long as the crossover holds, the increasing purchasing pressure raises the possibility of further price growth.
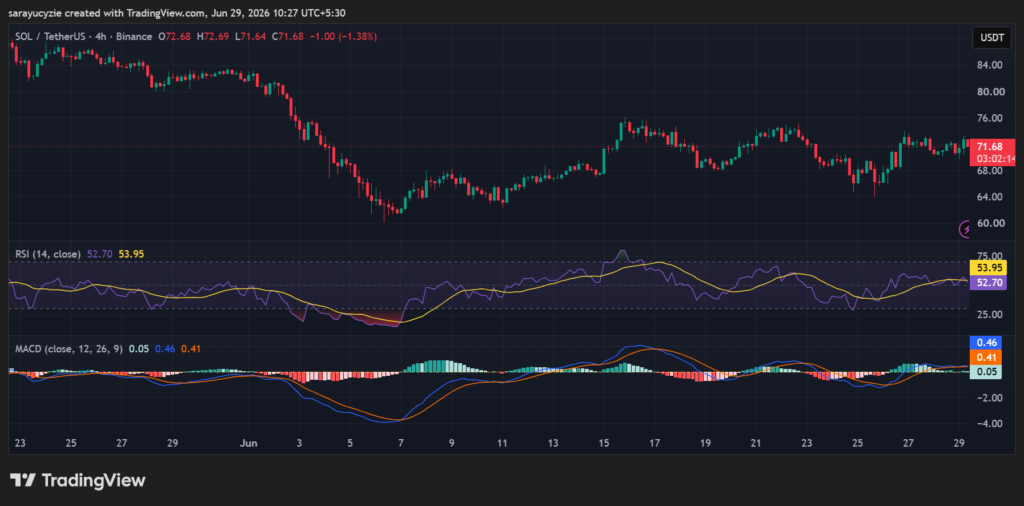 (Source: TradingView)
In addition, the market sentiment of Solana is slightly bullish, as the daily Relative Strength Index (RSI) is at 52.70. The reading is far from overbought, so if purchasing interest keeps growing, there is potential for more gains. This points to a stable market with a mild bullish bias.
Crypto Market Highlights
Solana (SOL) at a Crossroads: Break Higher or Slip Into Another Downtrend?


You May Also Like

StakeStone (STO) Rockets 125%: What $981M Trading Volume Reveals

Bitcoin-Backed Lending Market Shifts Toward Institutional Players, SVB Report Finds


