GameStop Stock Gets $600M EBITDA Upgrade — but the Chart Won’t Budge
GameStop stock sits at a crossroads. The daily chart remains structurally weak, yet a significant fundamental catalyst — a raised fiscal 2026 EBITDA outlook above $600 million and renewed eBay acquisition ambitions — is injecting fresh momentum into GME. The question is whether this can shift the dominant technical bias.
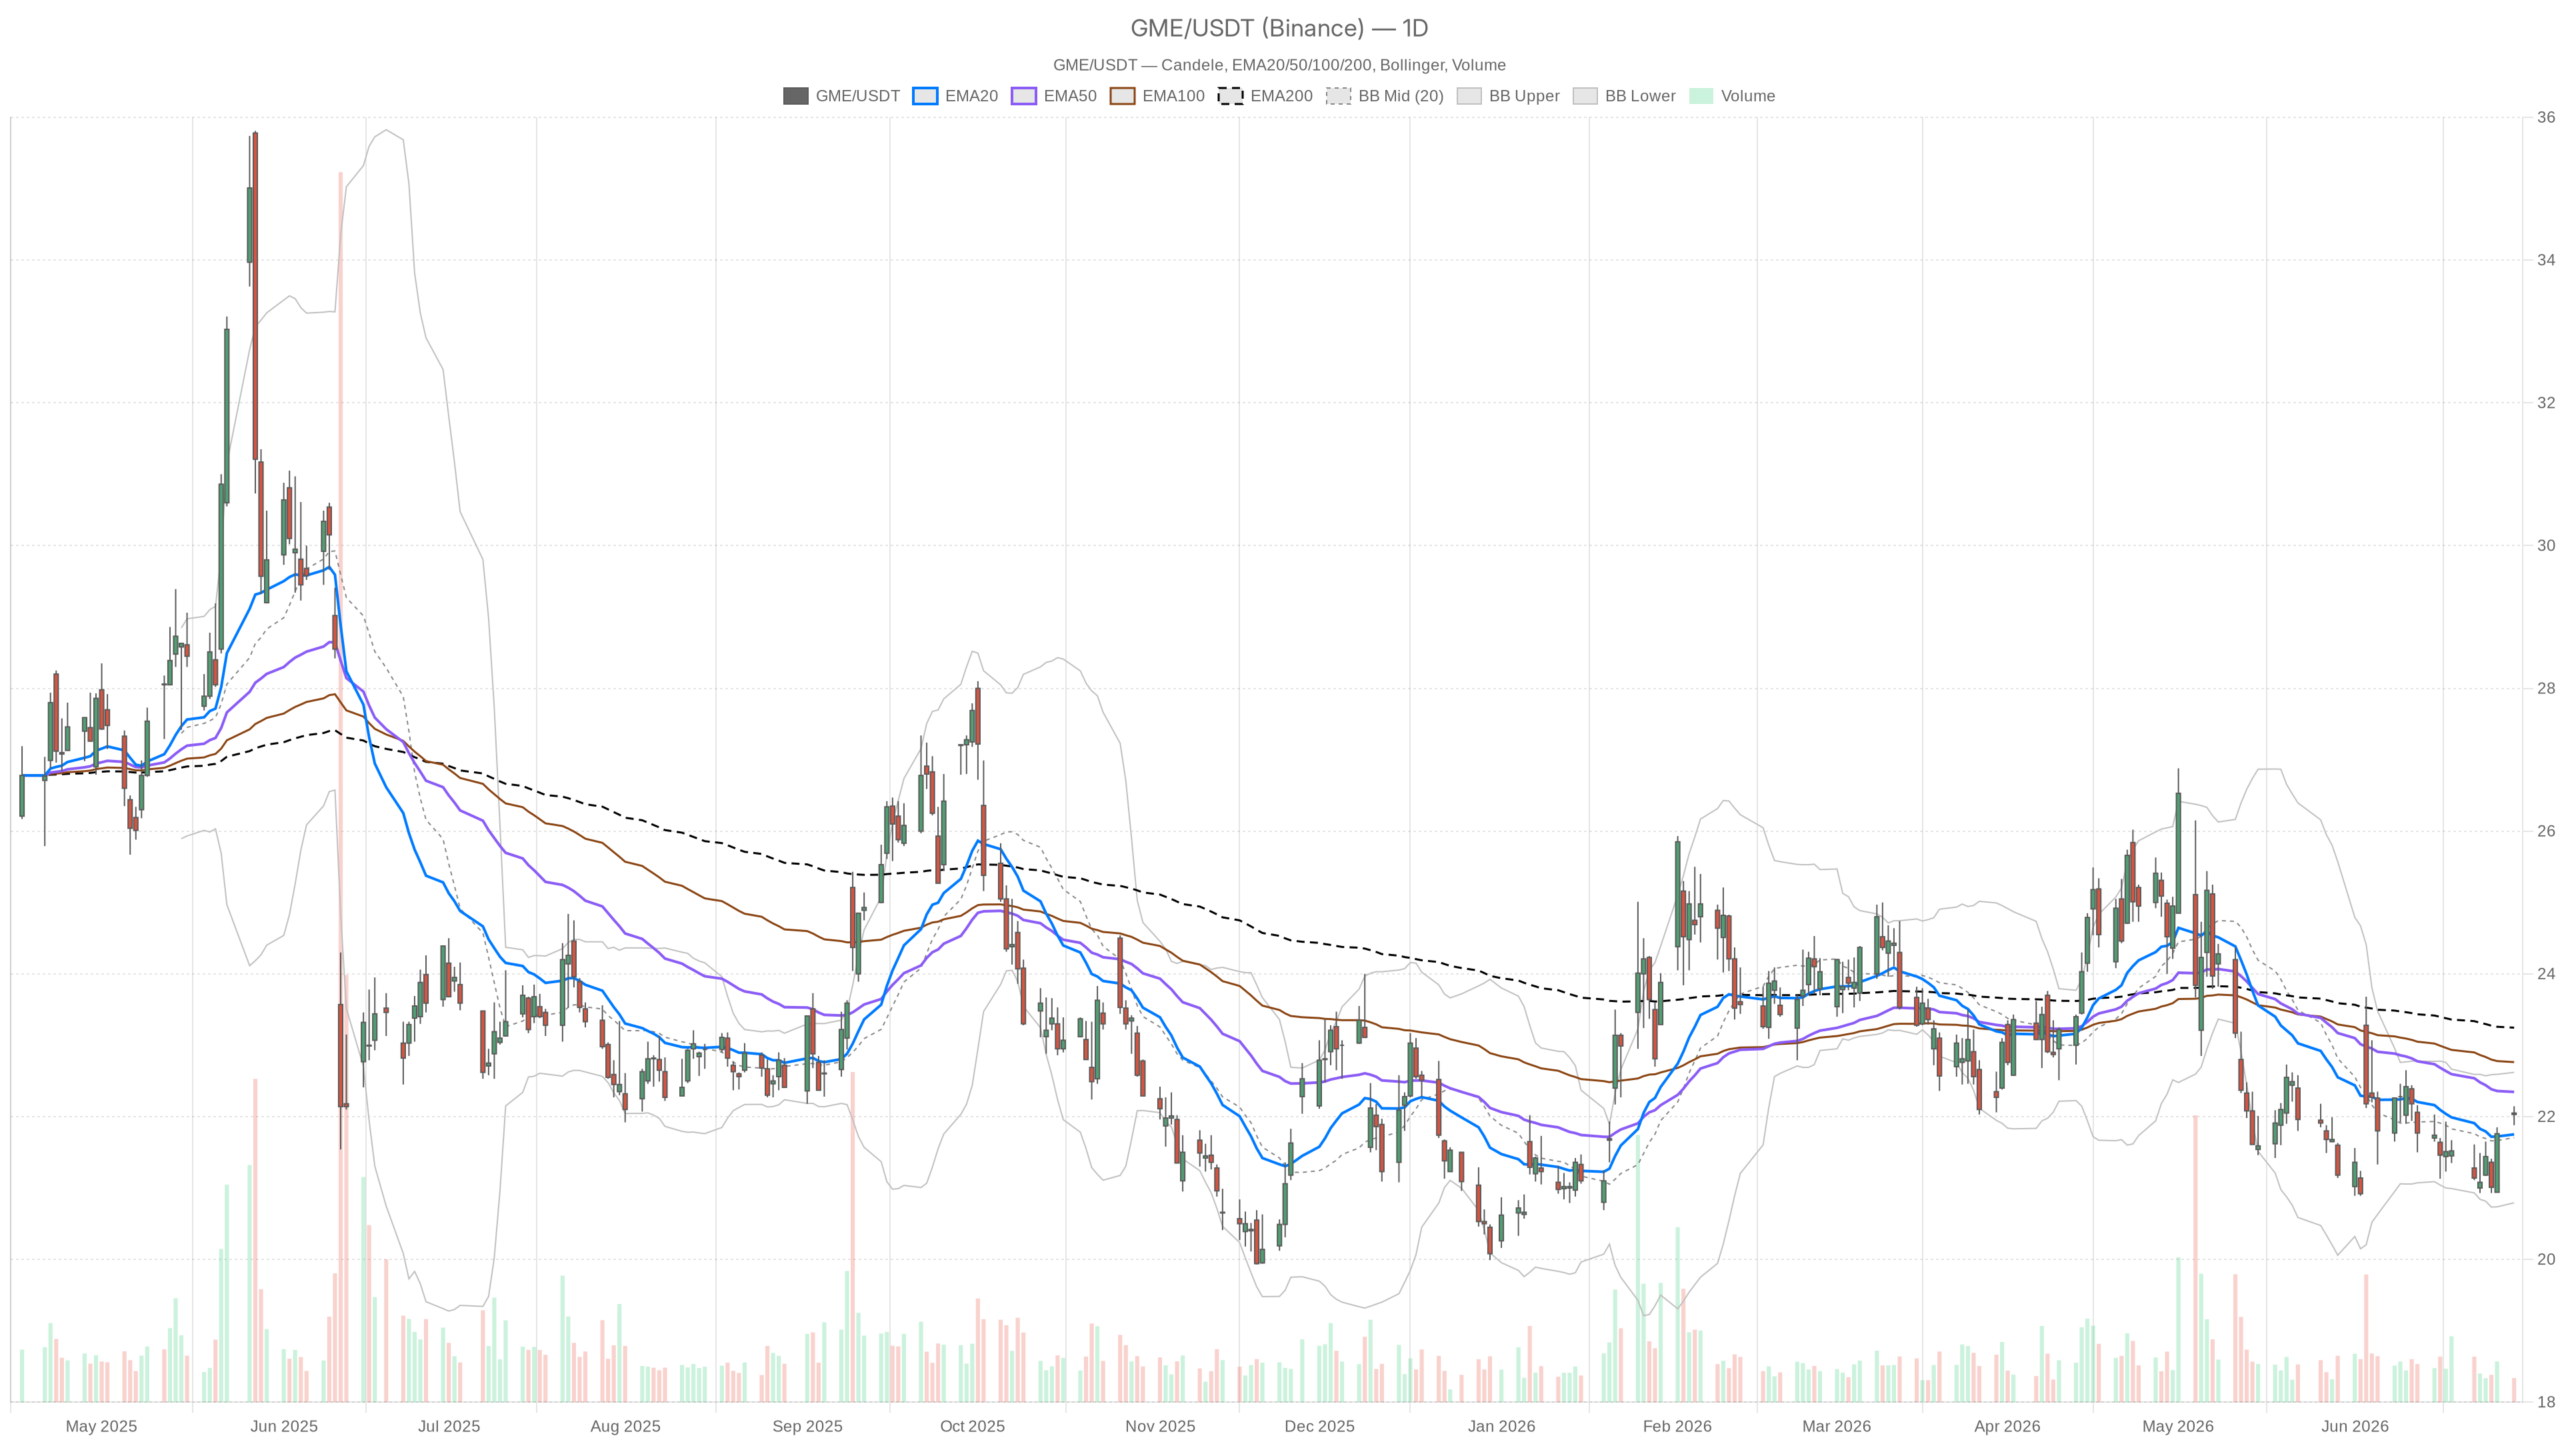 GME — daily chart with candlesticks, EMA20/EMA50 and volume.
Key takeaways
- GameStop stock closed at $22.03 on June 29, trading below both the 50-day EMA at $22.35 and the 200-day EMA at $23.25, signaling a structurally bearish daily chart.
- The company raised its fiscal 2026 EBITDA outlook to over $600 million — nearly double the $345 million posted in fiscal 2025 — and reaffirmed plans to pursue an eBay acquisition.
- Daily MACD shows early signs of bearish momentum exhaustion, with the histogram turning positive, while the daily RSI sits at a neutral 51.35.
- The hourly chart displays bullish EMA stack alignment, but the 1H RSI at 69.04 approaches overbought territory, warning of possible short-term exhaustion.
- A decisive daily close above the $22.35–$22.62 zone would validate a meaningful bullish shift; without it, the longer-term downtrend remains intact.
Where Does GameStop Stock Stand on the Daily Chart?
GameStop stock remains structurally bearish on the daily timeframe, trading below both its 50-day and 200-day exponential moving averages — a configuration that reflects an ongoing macro downtrend.
Moving Averages Confirm a Downtrend
GME closed at $22.03 on June 29, sitting beneath the 50-day EMA at $22.35 and the 200-day EMA at $23.25. Neither medium-term nor long-term trend support lies underneath current prices. The 20-day EMA at $21.75 provides a modest floor, but its proximity to price limits how much buffer it actually offers. This EMA stack alone tells a clear story: the stock is still inside a broader downtrend.
Bollinger Bands Show Compressed Volatility
The daily Bollinger Bands reinforce a muted picture. With the midline at $21.71 and the upper band at $22.62, GME trades in the upper half of the band — mildly constructive, but well short of breakout territory. The lower band sits at $20.79, marking the near-term downside boundary. Meanwhile, the daily ATR of $0.57 points to compressed volatility. For a historically explosive name like GME, this compression could set up a larger directional move. Direction, however, remains unconfirmed.
Is Daily Momentum Turning for GME?
Daily momentum indicators suggest bearish pressure is easing, though a confirmed trend reversal has not yet materialized.
The daily MACD offers cautious encouragement. The MACD line sits at -0.28, still in negative territory, but the histogram has turned positive at +0.08. This indicates bearish momentum is decelerating. The signal line at -0.35 sits below the MACD line, adding a preliminary bullish crossover signal. This is not confirmation of a reversal, but it does imply the selling pressure that defined prior weeks is beginning to exhaust.
The daily RSI at 51.35 reinforces this neutral-to-constructive view. It sits exactly in the middle of the range, neither overbought nor oversold. This leaves room for a move in either direction without immediate reversal risk from momentum alone. Taken together, the MACD and RSI suggest downside exhaustion rather than upside conviction — a subtle but important distinction for traders weighing entry timing.
Does Intraday Strength Override the Daily Downtrend?
Short-term bullish signals on the hourly chart are genuine, but they have not yet overcome the daily structural bearishness. Both realities can coexist.
Hourly Chart Flashes Bullish Alignment
The hourly timeframe introduces a notably different tone. Price closed at $22.02, comfortably above its 20-hour EMA at $21.69, 50-hour EMA at $21.56, and 200-hour EMA at $21.99. This full EMA stack alignment on the hourly is a genuinely bullish intraday signal. It shows the near-term buying wave — triggered by the EBITDA upgrade and eBay news — has established real momentum at the shorter timeframe level. However, the hourly RSI stands at 69.04, approaching overbought territory. That warns the move may be nearing short-term exhaustion.
The Tension Between Timeframes
The conflict between timeframes should not be dismissed. On the daily, GME remains below the EMA50 and EMA200 — structurally bearish. On the 1H, it has rallied through all key short-term moving averages — tactically bullish. A stock can trend up on the hourly while still being trapped in a larger downtrend on the daily. Until GME reclaims and holds above $22.35 on a daily closing basis, the medium-term bias stays cautious.
How Are Short-Term Levels Shaping GME’s Price Action?
Short-term indicators show buyers remain engaged near the $22.00 zone, with pivot levels and the 15-minute chart providing a contained, constructive structure.
On the 15-minute chart, the regime is flagged as bullish — the only timeframe showing that label explicitly. Price holds above the EMA20 at $22.00, EMA50 at $21.80, and EMA200 at $21.55. The Bollinger midline at $22.03 essentially matches the current price. The 15m MACD histogram has turned slightly negative at -0.02, hinting at a brief pause or micro-pullback. Still, the RSI at 56.36 remains constructive and not stretched. Near the $22.00–$22.03 zone, buyers remain engaged and any dips are currently being absorbed.
Daily pivot levels provide a useful structural framework. The pivot point sits at $22.02, almost exactly where GME closed. Resistance is thin just above at R1 of $22.16, while S1 at $21.89 marks the first meaningful support if buyers lose footing. Given the daily ATR of $0.57, a move from support to resistance fits comfortably within a single daily range. The immediate price action remains contained rather than expansive.
What Are the Scenarios for GameStop Stock Going Forward?
GameStop stock faces two competing scenarios — a bullish breakout driven by fundamental upgrades, and a bearish fade anchored in the unresolved daily downtrend.
The Bullish Case
The bullish case rests on the fundamental upgrade. If the eBay acquisition narrative gains credibility and the raised EBITDA guidance of over $600 million is taken seriously by institutional players, GME has the ingredients for a sustained breakout. A daily close above the 50-day EMA at $22.35 would provide the first technical validation. A push through the Bollinger upper band at $22.62 would confirm expanding volatility to the upside. In that scenario, the hourly momentum already in place would simply represent the early wave of a larger move.
The Bearish Case
In contrast, the bearish scenario is anchored in structural reality. The 200-day EMA at $23.25 and the 50-day EMA at $22.35 both sit above current price, acting as resistance layers. If the eBay story fails to attract durable buyer conviction, GME could quickly fade back toward the $21.75 EMA20 or even test the $20.79 lower Bollinger band. Broader market sentiment turning negative would only compound that risk. The hourly RSI near 69 already hints at short-term exhaustion. A rejection at current levels without a daily close above $22.35 would reinforce the view that this is a news-driven bounce within a broader downtrend, not a genuine reversal.
Overall, GameStop stock sits in an analytically honest position: fundamentally interesting, technically unresolved. The EBITDA upgrade and eBay ambition give the bulls a genuine story to run with. Yet the daily structure, still anchored below its medium- and long-term EMAs, demands evidence before extending too much conviction. Traders watching GME should treat the $22.35–$22.62 zone as the proving ground. A decisive move through that range on volume would signal something more meaningful is underway. Until then, the stock remains a short-term tactical story playing out inside a longer-term chart that has yet to turn.
FAQ
Is GameStop stock a buy right now based on the EBITDA upgrade?
The EBITDA upgrade to over $600 million is a significant fundamental catalyst, but the daily chart remains technically unresolved. GME is still trading below its 50-day and 200-day EMAs. A daily close above the $22.35–$22.62 zone would strengthen the bullish case. Until that happens, the longer-term downtrend persists.
What are the key resistance levels for GameStop stock?
The most important resistance levels are the 50-day EMA at $22.35 and the 200-day EMA at $23.25. The Bollinger upper band at $22.62 also serves as a near-term breakout threshold. A decisive move above this zone on volume would signal a potentially meaningful shift in GME’s technical structure.
What does the hourly chart reveal that the daily chart does not?
The hourly chart shows a fully aligned bullish EMA stack, with price above all three short-term moving averages — a genuinely constructive intraday signal. However, the 1H RSI at 69.04 is approaching overbought territory, suggesting the short-term rally may be nearing exhaustion. The daily chart, by contrast, remains below its key EMAs and structurally bearish.
Disclaimer: This article is for informational purposes only and does not constitute financial advice, an investment recommendation, or a solicitation to buy or sell any financial instrument or cryptocurrency. The analysis provided is not indicative of future results. Investing in crypto assets and financial markets carries a high risk of capital loss. Always do your own research (DYOR) and consult a qualified financial advisor before making any decision.
Article produced with the assistance of artificial intelligence and reviewed by the editorial team.


You May Also Like

Windish RV Center Expands Denver-Area Inventory with New Lance Travel Trailers

CoreWeave (CRWV) Stock Jumps on Historic $8.5B GPU-Backed Loan — What Investors Need to Know