This article introduces MENT-Flow, a novel method using normalizing flows to perform maximum-entropy tomography that scales straightforwardly to 6D phase space.This article introduces MENT-Flow, a novel method using normalizing flows to perform maximum-entropy tomography that scales straightforwardly to 6D phase space.

Invertible Generative Models for Beam Reconstruction: Introducing the MENT-Flow Approach

I. Introduction

II. Maximum Entropy Tomography

  • A. Ment
  • B. Ment-Flow

III. Numerical Experiments

  • A. 2D reconstructions from 1D projections
  • B. 6D reconstructions from 1D projections

IV. Conclusion and Extensions

V. Acknowledgments and References

B. MENT-Flow

In the absence of a method to directly optimize the Lagrange functions

\

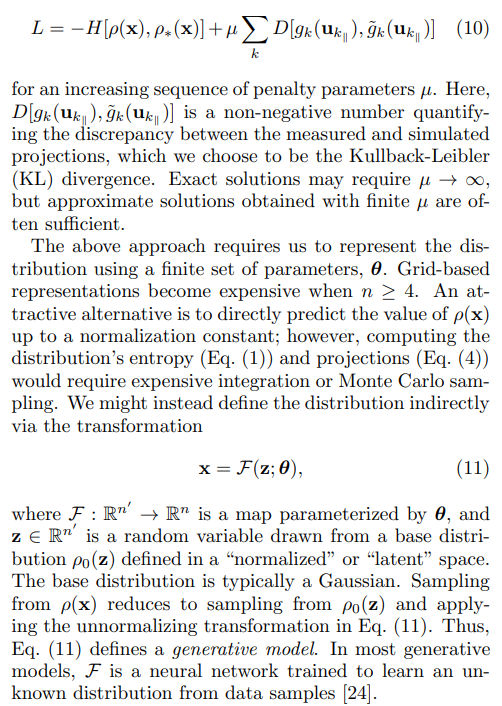
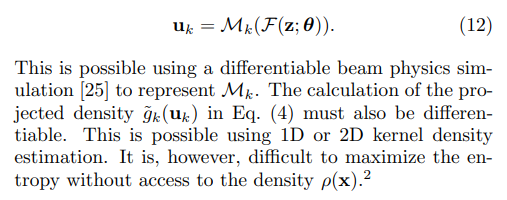
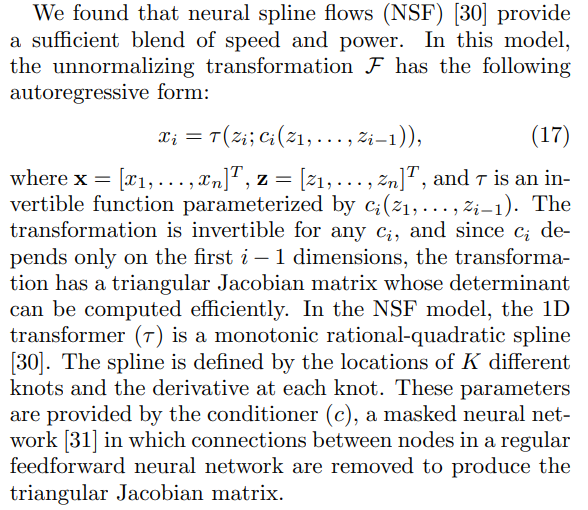
\ Roussel et al. [10] showed that generative models can also be trained to match projections of the unknown distribution. To train the model via gradient descent, the transformations from the base distribution to the measurement locations must be differentiable:

\

\

\

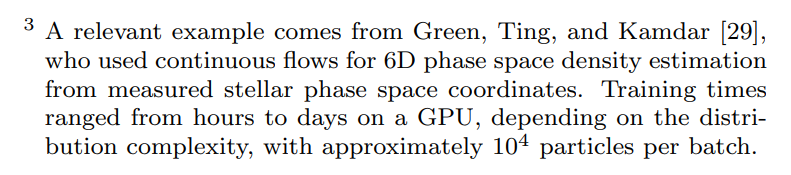
\ It is not immediately obvious whether normalizing flows can learn complex 6D distributions from projections in reasonable time. Flows preserve the topological features of the base distribution; for example, flows cannot perfectly represent disconnected modes if the base distribution has a single mode [28]. Thus, building complex flows requires layering transformations, either as a series of maps (discrete flows) or a system of differential equations (continuous flows), often leading to large models and expensive training.[3]

\

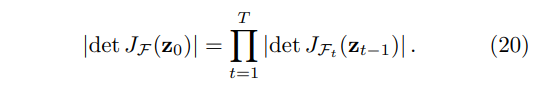
\ The model’s representational power increases with the number of parameters in the masked neural network and the number of knots in the rational-quadratic splines. We can also define more than one flow layer. For the composition of T layers

\

\ and transformed coordinates

\

\ the Jacobian determinant is available from

\

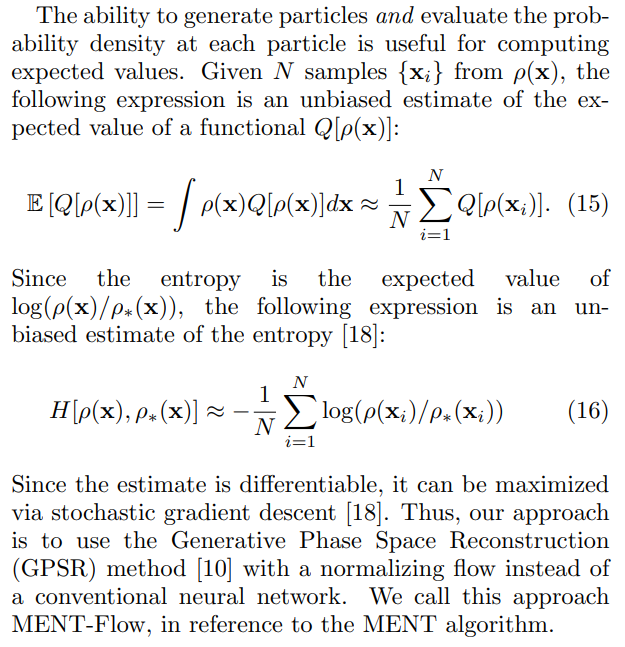
\ Compared to MENT, MENT-Flow increases the reconstruction model complexity and does not guarantee an exact entropy maximum. However, MENT-Flow scales straightforwardly to n-dimensional phase space and immediately generates independent and identically distributed samples from the reconstructed distribution function.

\

:::info Authors:

(1) Austin Hoover, Oak Ridge National Laboratory, Oak Ridge, Tennessee 37830, USA ([email protected]);

(2) Jonathan C. Wong, Institute of Modern Physics, Chinese Academy of Sciences, Lanzhou 730000, China.

:::


:::info This paper is available on arxiv under CC BY 4.0 DEED license.

:::

\

Market Opportunity
BEAM Logo
BEAM Price(BEAM)
$0.02989
$0.02989$0.02989
-5.56%
USD
BEAM (BEAM) Live Price Chart
Disclaimer: The articles reposted on this site are sourced from public platforms and are provided for informational purposes only. They do not necessarily reflect the views of MEXC. All rights remain with the original authors. If you believe any content infringes on third-party rights, please contact [email protected] for removal. MEXC makes no guarantees regarding the accuracy, completeness, or timeliness of the content and is not responsible for any actions taken based on the information provided. The content does not constitute financial, legal, or other professional advice, nor should it be considered a recommendation or endorsement by MEXC.

You May Also Like

MAXI DOGE Holders Diversify into $GGs for Fast-Growth 2025 Crypto Presale Opportunities

MAXI DOGE Holders Diversify into $GGs for Fast-Growth 2025 Crypto Presale Opportunities

Presale crypto tokens have become some of the most active areas in Web3, offering early access to projects that blend culture, finance, and technology. Investors are constantly searching for the best crypto presale to buy right now, comparing new token presales across different niches. MAXI DOGE has gained attention for its meme-driven energy, but early [...] The post MAXI DOGE Holders Diversify into $GGs for Fast-Growth 2025 Crypto Presale Opportunities appeared first on Blockonomi.
Share
Blockonomi2025/09/18 00:00
Bank of Canada cuts rate to 2.5% as tariffs and weak hiring hit economy

Bank of Canada cuts rate to 2.5% as tariffs and weak hiring hit economy

The Bank of Canada lowered its overnight rate to 2.5% on Wednesday, responding to mounting economic damage from US tariffs and a slowdown in hiring. The quarter-point cut was the first since March and met predictions from markets and economists. Governor Tiff Macklem, speaking in Ottawa, said the decision was unanimous. “With a weaker economy […]
Share
Cryptopolitan2025/09/17 23:09
Edges higher ahead of BoC-Fed policy outcome

Edges higher ahead of BoC-Fed policy outcome

The post Edges higher ahead of BoC-Fed policy outcome appeared on BitcoinEthereumNews.com. USD/CAD gains marginally to near 1.3760 ahead of monetary policy announcements by the Fed and the BoC. Both the Fed and the BoC are expected to lower interest rates. USD/CAD forms a Head and Shoulder chart pattern. The USD/CAD pair ticks up to near 1.3760 during the late European session on Wednesday. The Loonie pair gains marginally ahead of monetary policy outcomes by the Bank of Canada (BoC) and the Federal Reserve (Fed) during New York trading hours. Both the BoC and the Fed are expected to cut interest rates amid mounting labor market conditions in their respective economies. Inflationary pressures in the Canadian economy have cooled down, emerging as another reason behind the BoC’s dovish expectations. However, the Fed is expected to start the monetary-easing campaign despite the United States (US) inflation remaining higher. Investors will closely monitor press conferences from both Fed Chair Jerome Powell and BoC Governor Tiff Macklem to get cues about whether there will be more interest rate cuts in the remainder of the year. According to analysts from Barclays, the Fed’s latest median projections for interest rates are likely to call for three interest rate cuts by 2025. Ahead of the Fed’s monetary policy, the US Dollar Index (DXY), which tracks the Greenback’s value against six major currencies, holds onto Tuesday’s losses near 96.60. USD/CAD forms a Head and Shoulder chart pattern, which indicates a bearish reversal. The neckline of the above-mentioned chart pattern is plotted near 1.3715. The near-term trend of the pair remains bearish as it stays below the 20-day Exponential Moving Average (EMA), which trades around 1.3800. The 14-day Relative Strength Index (RSI) slides to near 40.00. A fresh bearish momentum would emerge if the RSI falls below that level. Going forward, the asset could slide towards the round level of…
Share
BitcoinEthereumNews2025/09/18 01:23