Crypto Market Weekly Review (October 13th - 19th): How to cope with the BTC cycle under the heavy pressure of the cyclical law "curse"?
Author: 0xBrooker
The progress of the US-China tariff conflict remains the biggest variable affecting major global financial markets. Although there has been some easing of tensions between the two sides this week, whether there will be real progress still depends on the upcoming negotiations between the two delegations. The key mid-term node is whether the leaders of the two countries can meet as scheduled during the APEC in South Korea.
The Federal Reserve's continued dovish stance, coupled with the sluggish US job market, has led to market expectations for two 50 basis point rate cuts this year, providing underlying support for risky assets.
Beyond the US-China tariff conflict and the Fed's dovish stance, BTC remains plagued by internal market structural issues. On one hand, over $20 billion in notional value has been wiped out from the futures market, making it difficult to gather momentum in the short term. Furthermore, the continued selling of long-term investors, driven by the cyclical nature of the market and facing insufficient capital, has made it difficult for the market to stabilize and rebound.
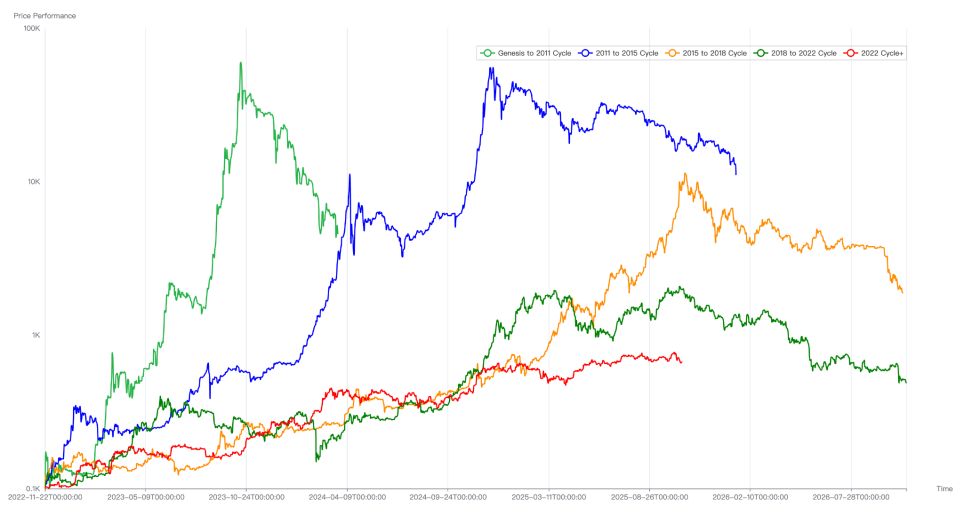
Comparison of BTC Trends over the Past Cycles
Another key point worth paying attention to is that US AI and technology stocks will enter the Q3 earnings reporting period starting next week. Whether their performance meets expectations will also have a significant impact on the financial market.
Policy, macro-financial and economic data
The main factor influencing the US stock market recently has been the various rhetoric surrounding the US-China trade war. Following last week's heavy-handed attempts at mutual restraint, both sides have released somewhat conciliatory rhetoric this week to soothe market sentiment. The US, in particular, has been circulated by President Trump and the Treasury Secretary, offering conciliatory rhetoric on various occasions, stating that high tariffs are unsustainable, that US-China relations remain strong, and that the US is unwilling to decouple from China economically, a sentiment shared by China. In contrast, China's response has been more measured, attributing the "global panic" to US rhetoric and actions toward China and emphasizing that export controls are driven by national security and industrial policy needs.
According to media reports, the two delegations are about to engage in another round of contacts and negotiations. South Korea has confirmed that the US president will visit South Korea during APEC at the end of the month. Of course, whether the US and Chinese leaders can meet as scheduled during this period depends on whether the upcoming round of negotiations between the two delegations can achieve progress.
Due to the easing of the tariff war, US stocks, which were experiencing a data-free period, temporarily stabilized, with the Nasdaq rising 2.14% for the week. The US dollar index, which had been approaching 100, fell 0.3% to close at 98.547. However, risk appetite has yet to fully improve, and the influx of funds pushed the 10-year US Treasury yield down 2.53% for the week, closing at 4.015%. Gold, however, experienced a fear-mongering (FOMO) rally, surging 5.76% for the week.
Due to the US government shutdown, the release of several economic and employment data has been delayed. Federal Reserve Chairman Powell emphasized at the Philadelphia meeting that "the risk of weakening employment is of greater concern" and mentioned the possibility of a conditional end to balance sheet reduction. The overall tone is cautiously dovish, leaving room for further interest rate cuts. FedWatch is already fully pricing in a 50 basis point rate cut in October and December of this year.
In the US stock market, major banks reported earnings exceeding expectations, but two regional banks were reported to have over $50 million in bad debts, sparking a period of market panic. Next week, AI and tech stocks, which are key market drivers, will begin their Q3 earnings season. While earnings exceeding expectations may provide some support for the volatile market, those falling short of expectations are likely to drive a downward correction.
Crypto Market
In last week's weekly report, we mentioned that the Bitcoin and crypto markets are currently under the dual influence of the US-China tariff war and the cyclical curse. This combination of factors has prevented Bitcoin from recovering from last week's losses along with the Nasdaq, instead continuing its downward trend. On top of last week's 6.84% drop, it has fallen another 5.55% this week.
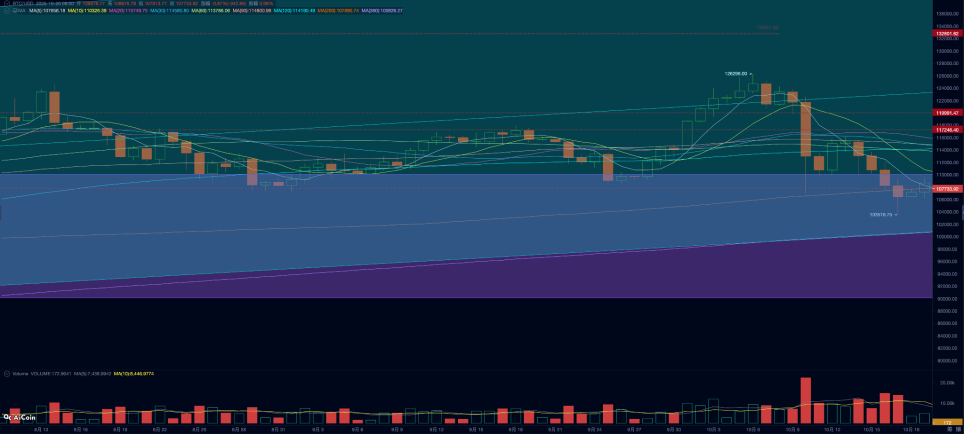
BTC daily trend
Technically, BTC prices have fallen into the "Trump bottom" range ($90,000-110,000), a range that has held resistance and support for nearly a year since Trump's election in 2024. Furthermore, BTC has also briefly fallen below its 200-day moving average of $107,500, placing it technically on the line separating bull and bear markets.
While BTC prices have fallen below their 200-day moving average several times during this bull market, perhaps this time is different? According to BTC's cyclical patterns, BTC has already entered its peaking phase. It's noteworthy that long-term investors, most influenced by the cyclical patterns, are accelerating their sell-offs, making it difficult for capital inflows into the weakening market to bear the brunt of the pressure.
According to eMerge Engine statistics, the scale of selling by long- and short-term groups this week was 149,496 coins, which was lower than last week. Among them, the long-term group sold 19,978 coins, which was significantly higher than last week.
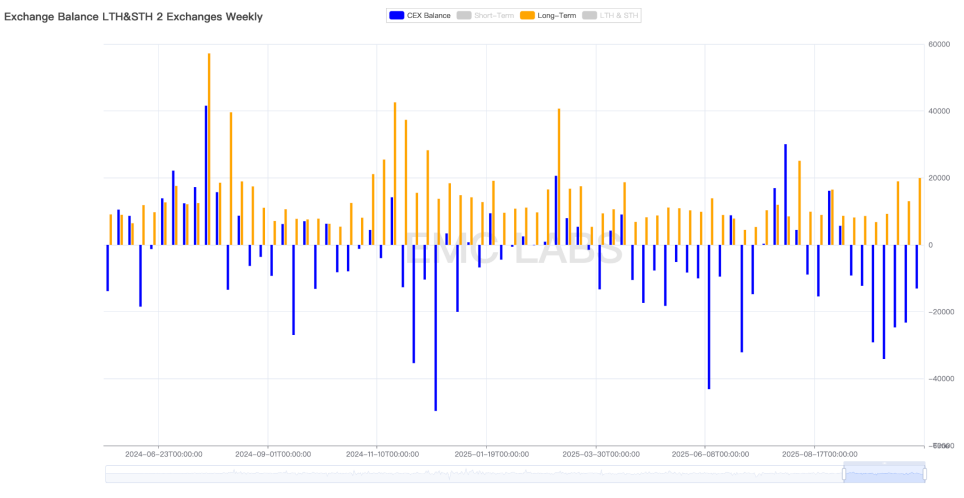
Statistics on long-term selling and changes in the inventory of centralized exchanges (weekly)
Long-term investors are believers in traditional BTC cycles. Their selling has a profound impact on the market and has been the most important force shaping previous cycle tops. Their continued selling may be due to the "curse" of the cycle. Breaking the old cycle and forming a new one will require the action of greater structural forces (such as DATs and BTC Spot ETF channel funds).
Capital inflows declined again this week, following last week's decline. The BTC Spot ETF saw nearly $1.2 billion in outflows. Short-term capital outflows from ETFs due to the US-China tariff war were another major factor contributing to the rapid and sustained decline in BTC prices, in addition to long-term selling.
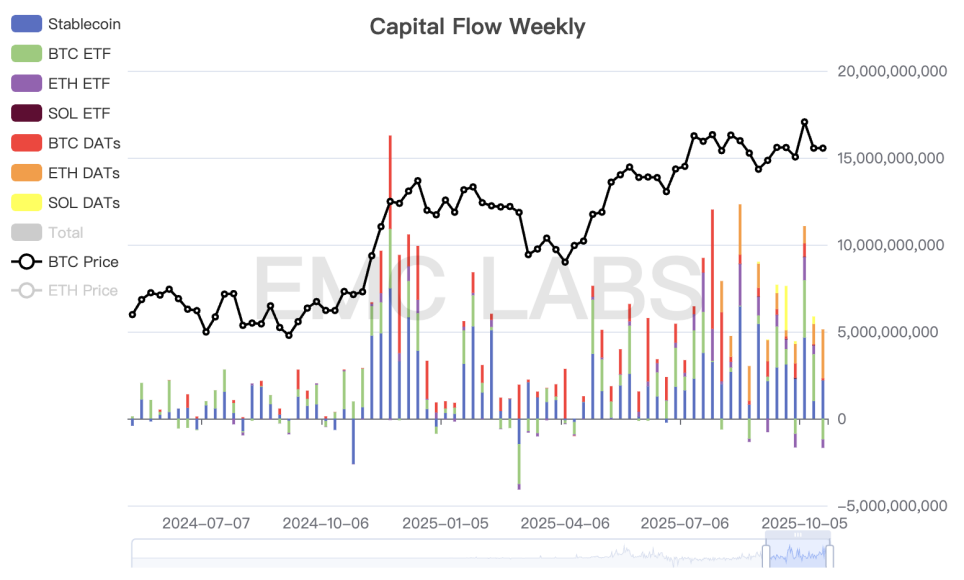
Crypto Market Capital Flow Statistics (Weekly)
Furthermore, the contract market's open interest continued to decline this week after a sharp drop last week, with fees briefly falling into negative territory. This suggests that long positions in the contract market are struggling to rally in the short term after the massive sell-off.
Judging from technical analysis, long-term selling, capital inflows and outflows, and futures market structure, BTC prices are currently under significant pressure. Unless the US-China tariff war significantly improves and revitalizes market sentiment, a short-term or medium-term reversal is unlikely. Combined with the influence of the cyclical law, we believe long-term investors should position themselves for the end of the cycle. As stated in the September monthly report, the end of the old cycle and the beginning of a new one is a probabilistic event, not impossible, but it is now considered a high-probability event.
Cycle indicators
According to eMerge Engine, the EMC BTC Cycle Metrics indicator is 0, indicating that it is in the transition period.


You May Also Like

Red state immigration law stopped cold by GOP-appointee days before it was to take effect

USDC Treasury mints 250 million new USDC on Solana