Bitcoin price hovers near $107,000 as legacy wallets quietly sell into institutional demand, keeping prices range-bound despite rising activity. At press time, Bitcoin was trading at $107,619, down 2.8% from the previous day. The coin moved between $107,623 and $111,555…Bitcoin price hovers near $107,000 as legacy wallets quietly sell into institutional demand, keeping prices range-bound despite rising activity. At press time, Bitcoin was trading at $107,619, down 2.8% from the previous day. The coin moved between $107,623 and $111,555…

Bitcoin price trades sideways as old wallets sell into institutional demand

Bitcoin price hovers near $107,000 as legacy wallets quietly sell into institutional demand, keeping prices range-bound despite rising activity.

Summary
  • Bitcoin trades sideways, hovering near $107K after a volatile week.
  • Long-term holders continue selling into institutional inflows, limiting upside.
  • Technicals stay neutral-to-bearish with resistance at $115K and support near $107K.

At press time, Bitcoin was trading at $107,619, down 2.8% from the previous day. The coin moved between $107,623 and $111,555 during the period, extending a 5% weekly and 7% monthly decline. After weeks of volatility, Bitcoin is now 14% below its all-time high of $126,080 set on Oct. 6.

Trading activity has picked up slightly, with $60.7 billion in volume over the last day, an 11.4% increase from the previous session. This rise shows that traders are becoming more active around current Bitcoin (BTC) price levels. However, according to CoinGlass data, open interest fell 2.3% to $70.12 billion, while derivatives volume fell 19% to $102.37 billion.

These figures suggest traders are reducing short-term holdings, which often indicates uncertainty and a wait-and-see attitude in the market.

Bitcoin selling pressure and market dynamics

A new report by 10x Research, published on Oct. 21, highlights two major forces holding Bitcoin back. The first is that digital asset treasury firms have slowed their buying, with companies like Strategy now adding smaller amounts of Bitcoin compared to previous quarters. The second is that long-term holders are selling into the demand created by Bitcoin exchange-traded funds.

This steady selling has prevented a strong breakout, keeping prices in a tight range near $110,000. According to 10x Research, Bitcoin’s performance depends more on new capital entering the market than on interest rates or macroeconomic policy. Without a clear wave of new inflows, volatility is expected to stay low and the price action subdued.

This view is supported by another Oct. 21 analysis by CryptoQuant Arab Chain. They pointed out that in October, sellers dominated Bitcoin futures, which caused the long/short ratio to drop to 0.955. This implies that traders are exercising caution and have a slight bearish outlook. Despite this, Bitcoin has held above $107,000, showing that buyers are still active at lower levels.

Bitcoin price technical analysis

Bitcoin’s technical indicators reflect a neutral-to-bearish setup. Although the momentum has slowed, the relative strength index, which is at 40, has not yet reached oversold territory. Both the momentum and MACD indicators continue to send sell signals, confirming mild downside pressure.

Bitcoin price trades sideways as old wallets sell into institutional demand - 1

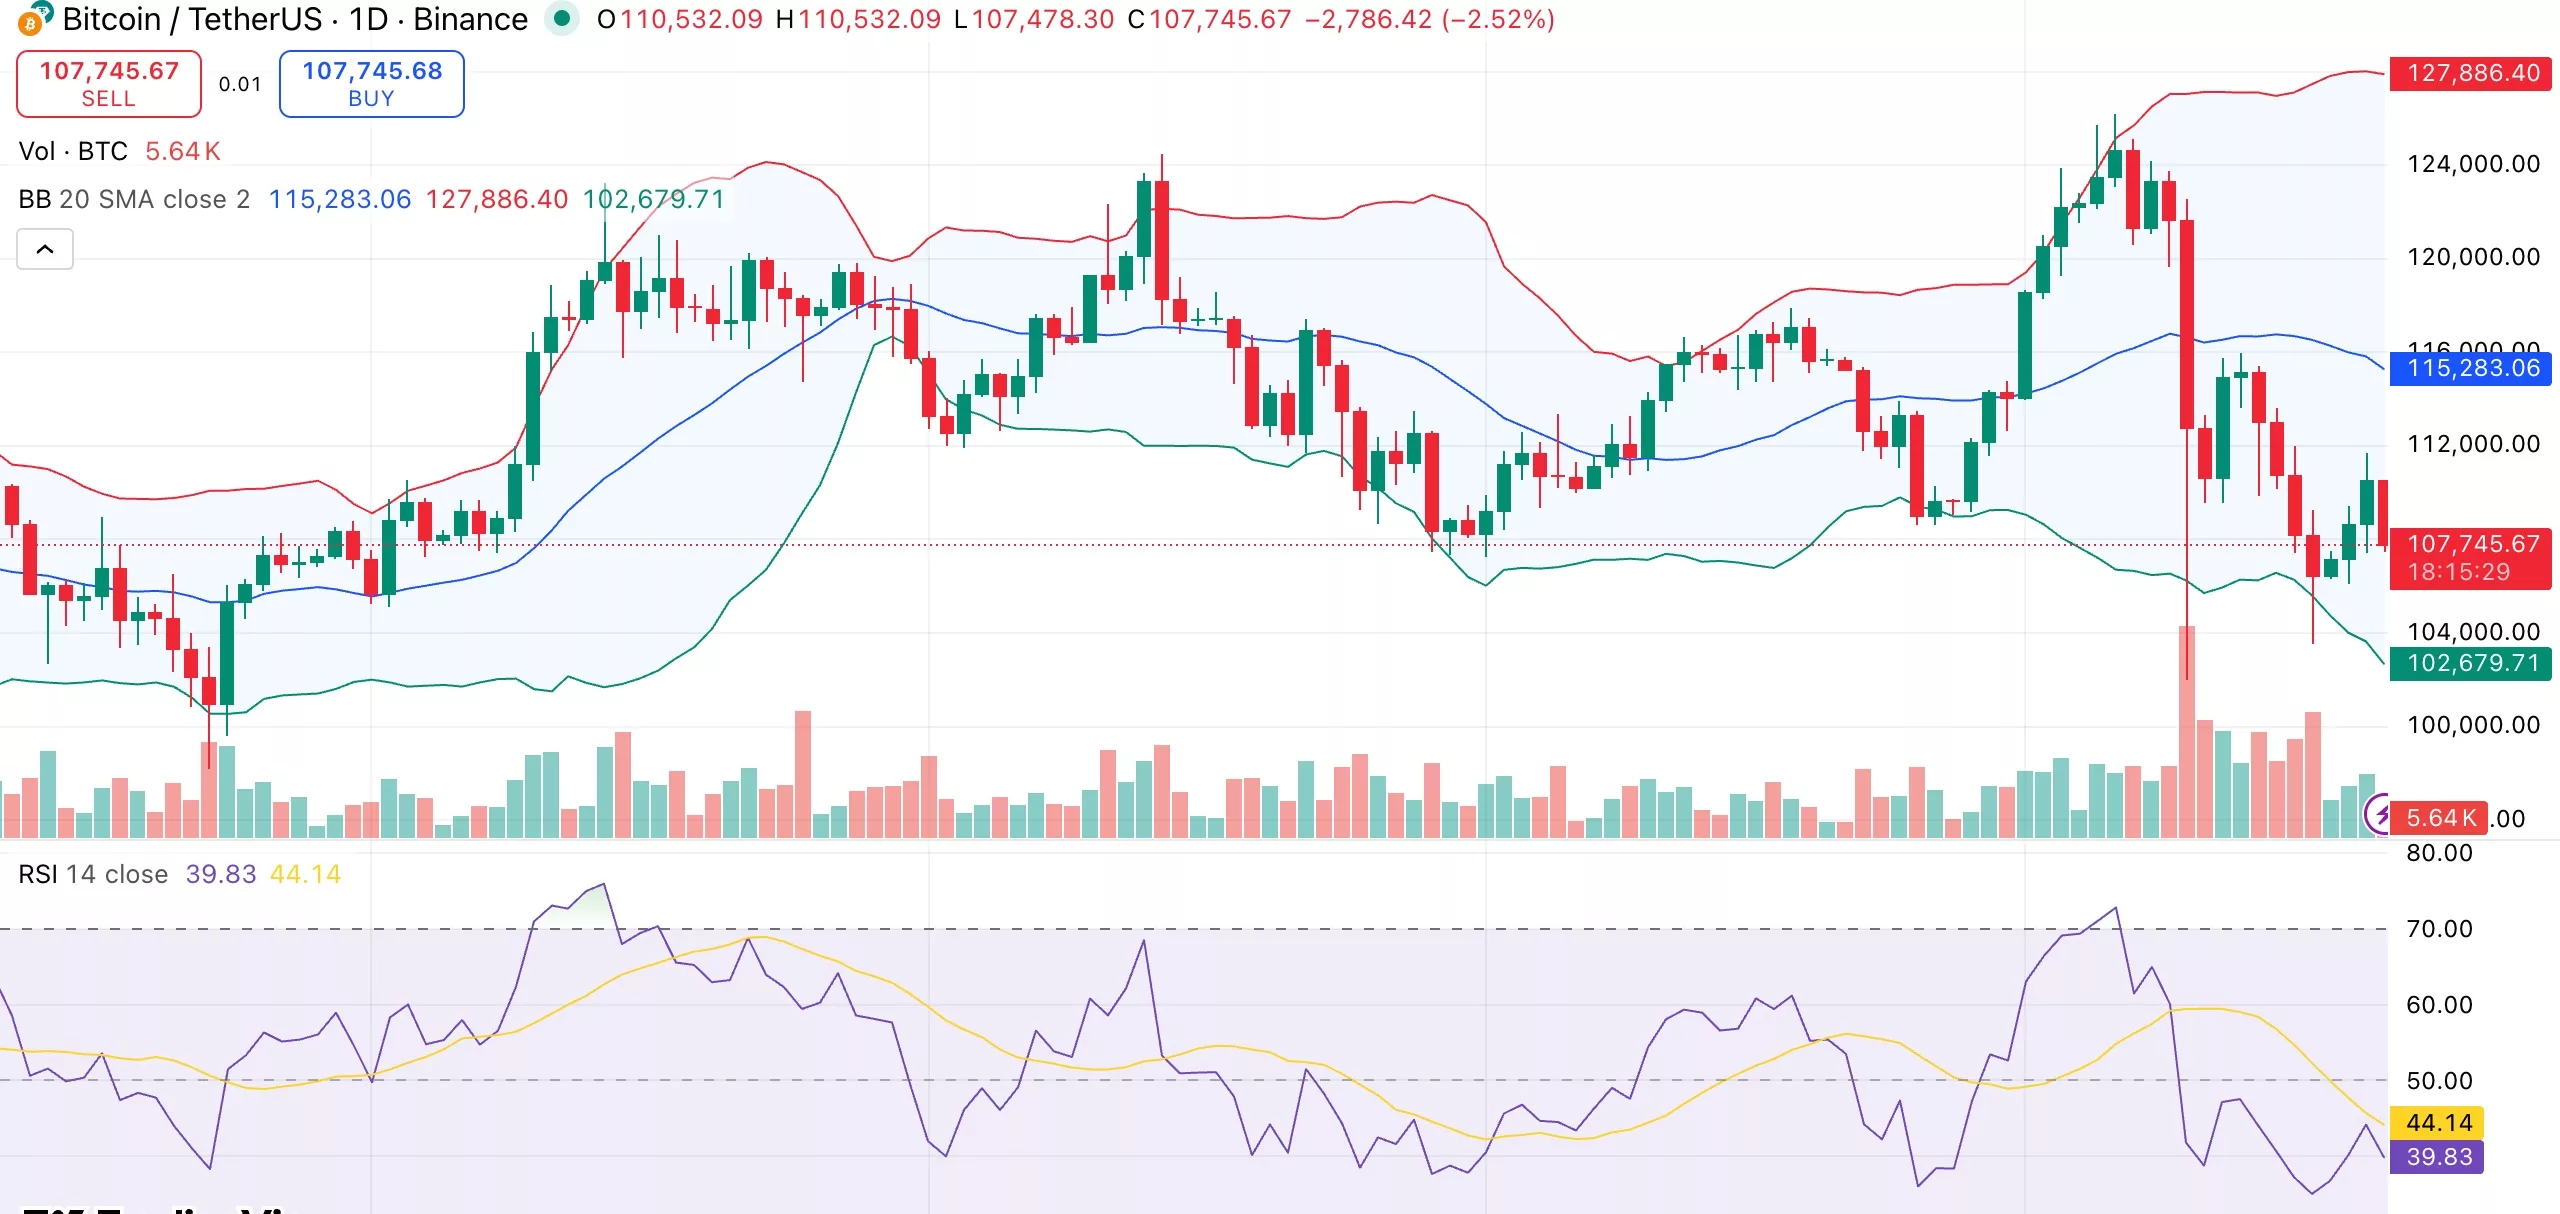
All of the major moving averages from the 10-day to the 200-day line are above the current price. This points to a bearish trend for the medium term. While resistance can be found between $112,000 and $115,000, immediate support is located near $107,000.

Bitcoin could fall back toward $102,000 if it is unable to maintain its current range. On the upside, a strong move above $115,000 might pave the way for a return to $120,000 and higher.

Disclosure: This article does not represent investment advice. The content and materials featured on this page are for educational purposes only.

Market Opportunity
NEAR Logo
NEAR Price(NEAR)
$1.684
$1.684$1.684
-1.75%
USD
NEAR (NEAR) Live Price Chart
Disclaimer: The articles reposted on this site are sourced from public platforms and are provided for informational purposes only. They do not necessarily reflect the views of MEXC. All rights remain with the original authors. If you believe any content infringes on third-party rights, please contact [email protected] for removal. MEXC makes no guarantees regarding the accuracy, completeness, or timeliness of the content and is not responsible for any actions taken based on the information provided. The content does not constitute financial, legal, or other professional advice, nor should it be considered a recommendation or endorsement by MEXC.

You May Also Like

The Channel Factories We’ve Been Waiting For

The Channel Factories We’ve Been Waiting For

The post The Channel Factories We’ve Been Waiting For appeared on BitcoinEthereumNews.com. Visions of future technology are often prescient about the broad strokes while flubbing the details. The tablets in “2001: A Space Odyssey” do indeed look like iPads, but you never see the astronauts paying for subscriptions or wasting hours on Candy Crush.  Channel factories are one vision that arose early in the history of the Lightning Network to address some challenges that Lightning has faced from the beginning. Despite having grown to become Bitcoin’s most successful layer-2 scaling solution, with instant and low-fee payments, Lightning’s scale is limited by its reliance on payment channels. Although Lightning shifts most transactions off-chain, each payment channel still requires an on-chain transaction to open and (usually) another to close. As adoption grows, pressure on the blockchain grows with it. The need for a more scalable approach to managing channels is clear. Channel factories were supposed to meet this need, but where are they? In 2025, subnetworks are emerging that revive the impetus of channel factories with some new details that vastly increase their potential. They are natively interoperable with Lightning and achieve greater scale by allowing a group of participants to open a shared multisig UTXO and create multiple bilateral channels, which reduces the number of on-chain transactions and improves capital efficiency. Achieving greater scale by reducing complexity, Ark and Spark perform the same function as traditional channel factories with new designs and additional capabilities based on shared UTXOs.  Channel Factories 101 Channel factories have been around since the inception of Lightning. A factory is a multiparty contract where multiple users (not just two, as in a Dryja-Poon channel) cooperatively lock funds in a single multisig UTXO. They can open, close and update channels off-chain without updating the blockchain for each operation. Only when participants leave or the factory dissolves is an on-chain transaction…
Share
BitcoinEthereumNews2025/09/18 00:09
SUI Price Eyes Breakout, Targets $11 Says Analyst

SUI Price Eyes Breakout, Targets $11 Says Analyst

The post SUI Price Eyes Breakout, Targets $11 Says Analyst appeared on BitcoinEthereumNews.com. SUI price shows a technical setup for a macro breakout with analyst Dan Gambardello targeting $10-$11 levels. Recent partnership with Google’s Agentic Payments Protocol adds fundamental support to the technical analysis as SUI moves closer to potential breakout levels. SUI Price Analysis Points to $10-$11 Breakout Target Dan Gambardello has identified a clear ascending triangle formation on SUI price daily chart with upside targets around $10.79. The analyst simplified this target range to $10-$11 for practical trading purposes. The pattern shows sustained higher lows meeting resistance at current levels before a potential breakout. VanEck maintains more aggressive SUI crypto targets ranging from $13-$25 according to Gambardello’s research. SUI Price Analysis | Source: Dan Gambardello, X The $10 level is a more conservative higher high area for the current cycle. Midterm targets point to $7.50 in the 1.618 Fibonacci extension zone before longer-term objectives. The monthly RSI shows extreme compression that Gambardello describes as “screaming for a macro breakout to the upside.” This momentum oscillator behavior typically precedes major price movements in the crypto market. SUI crypto risk model currently sits at 51 and matches pre-bull market levels seen in coins like Ethereum. Gambardello compared this to Ethereum’s December 2020 reading of 51 before its major breakout. The March 2017 Ethereum reading of 53 preceded that cycle’s parabolic move. The analyst also noted that SUI price trades near the same levels from almost a year ago in November 2024. Bollinger Bands Signal Historic Compression CryptoBullet has identified the tightest Bollinger Bands in SUI’s entire trading history on the weekly chart. The BBW indicator compression reached levels that were historically followed by major price movements. This setup mirrors conditions before SUI’s previous major rallies. Historical data shows SUI price delivered +253% gains between December 2023 and March 2024 following similar compression. SUI…
Share
BitcoinEthereumNews2025/09/18 11:32
How Zero Knowledge Proof Is Changing Blockchain Performance Forever

How Zero Knowledge Proof Is Changing Blockchain Performance Forever

The post How Zero Knowledge Proof Is Changing Blockchain Performance Forever appeared on BitcoinEthereumNews.com. Crypto Projects Learn how Zero Knowledge Proof
Share
BitcoinEthereumNews2026/01/13 04:11