Sei Network tops Layer-1 usage, and it is driven by the increased institutional adoption. Signals suggest that the token's price could hit $0.20.Sei Network tops Layer-1 usage, and it is driven by the increased institutional adoption. Signals suggest that the token's price could hit $0.20.

Sei Leads Layer-1 Usage, Price Eyes $0.20

2025/10/23 22:00
3 min read
For feedback or concerns regarding this content, please contact us at [email protected]
sei
  • Sei has surpassed key competitors in the Layer-1 category through increased tokenized activities on it by institutions.  
  • The technical indicators, including the RSI and MACD, reveal that Sei is facing a bottom and can possibly bounce back up.  
  • Traders are positioning themselves at the present price level of the token, this is an indication that they expect a rebound.

Sei Network is the primary Layer-1 network compared to Sui, Polygon, and Aptos as stated by a recent a16z report. The report also recorded that Sei has the most active addresses in the last month, but the token price is still under $0.18.  

Sei Expansion is through Institutional Adoption

During the third quarter alone, its volume of DEX surged past $10 billion, with the activity of tokenized assets exploding. The Sei Network team pointed out the achievement on X, adding that institutional products are already transitioning to its chain.

The team also stated that BlackRock, Apollo, and a number of asset managers have initiated exchange-traded strategies on Sei too.  Also, the three ETF filings this quarter further indicated support for the infrastructure of leading financial products on the network. With the architecture of Sei optimized for speed and efficiency, developers are flocking to the network.

Technicals Display Important Support Area

Sei is trading close to $0.180 on the 4-hour chart and is around its 1.618 Fibonacci retracement point of $0.172. The retracement pattern indicates that there may be a local bottom here in case the volume is high and the selling pressure is low.

The next resistance level from the VWAP indicator is close to $0.186. Breaking over this zone would indicate a possibility of the bearish trend being reversed, and short-term accumulation will be encouraged. Therefore, the price could retest the $0.19 to $0.20 level. A valid close at this level will put the market back in favor of buyers.

SEI

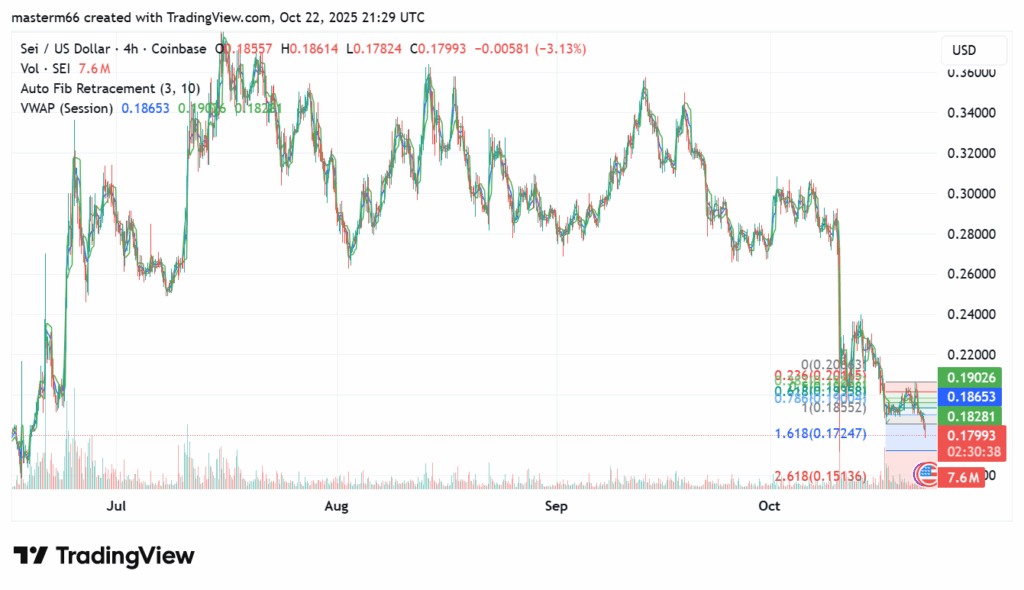
Fib. and VAWP. Source: TradingView

Also Read | Sei (SEI) Price Forecast: Accumulation Zone Signals 20X Upside Potential

Momentum Indicators Signify Drop in Bearishness

The token is almost in the oversold region with the Relative Strength Index (RSI) standing under 30.5. Such levels tend to lead to a bounce in the past, especially when there is increased trading volume. The flat trend of the RSI suggests that the downward movement could be forming a slowdown with sellers becoming fatigued.  

The MACD (Moving Average Convergence Divergence) is showing an indication of weakening bearish momentum. This is because the difference between the MACD line and its signal line is becoming narrow, as depicted in the histogram.

SEI

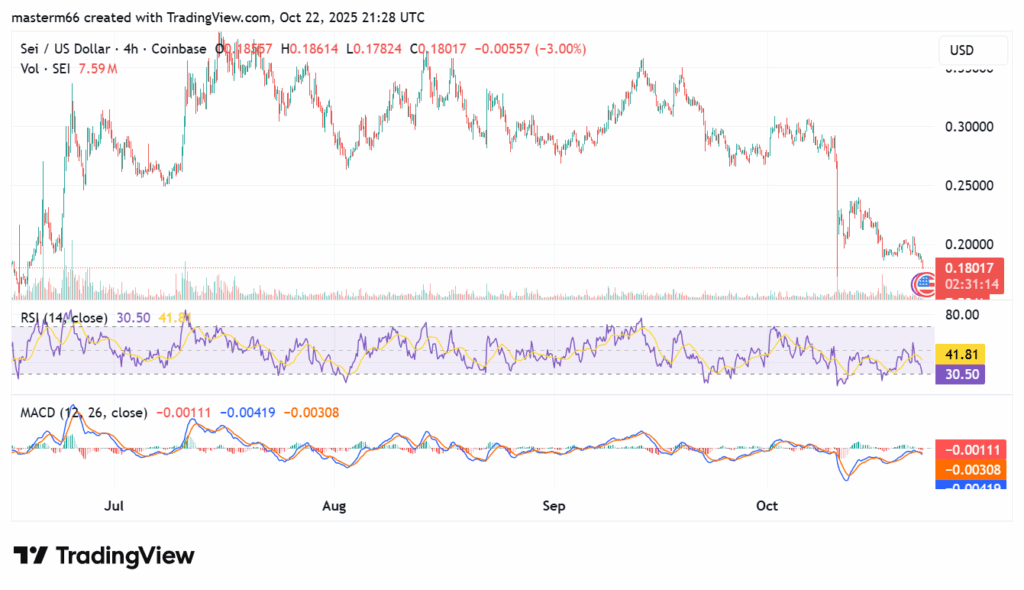
MACD and RSI. Source: TradingView

Derivatives Data Indicates More Purchases Around $0.17

According to CoinGlass, the volume of derivatives increased by 28.4% in the last day. But the open interest decreased by 6.3% to 97.09 million dollars within the same period.

This indicates that short-term traders are exiting their positions as new traders acquire more tokens at lower prices. Growing interest, indicated by the increase in trading volume, is also an indicator of interest by futures traders despite the consolidation.
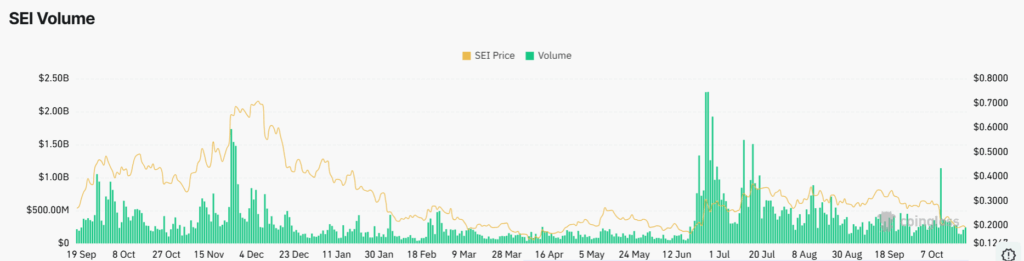
SEI

Source: CoinGlass

Also Read | SEI Nears Key Support as Network Hits $10 Billion DEX Trading Milestone

Disclaimer: The articles reposted on this site are sourced from public platforms and are provided for informational purposes only. They do not necessarily reflect the views of MEXC. All rights remain with the original authors. If you believe any content infringes on third-party rights, please contact [email protected] for removal. MEXC makes no guarantees regarding the accuracy, completeness, or timeliness of the content and is not responsible for any actions taken based on the information provided. The content does not constitute financial, legal, or other professional advice, nor should it be considered a recommendation or endorsement by MEXC.

You May Also Like

Unlimit Appoints Irene Skrynova as CEO, Global Payments

Unlimit Appoints Irene Skrynova as CEO, Global Payments

Unlimit announced the appointment of Irene Skrynova as CEO, Global Payments, as the company accelerates its evolution into a global financial infrastructure platform
Share
ffnews2026/03/12 18:17
Analyst Predicts ‘Uptober’ Rally for BTC Regardless of FOMC Decision

Analyst Predicts ‘Uptober’ Rally for BTC Regardless of FOMC Decision

The post Analyst Predicts ‘Uptober’ Rally for BTC Regardless of FOMC Decision appeared on BitcoinEthereumNews.com. Bitcoin traded at $116,236 as of 14:04 UTC on Sept. 17, up about 1% in the past 24 hours, holding above a key level as markets await the Federal Reserve’s policy announcement. Analysts’ comments Dean Crypto Trades noted on X that bitcoin is only about 7% above its post-election local peak, while the S&P 500 has risen 9% and gold has surged 36% during the same period. He said bitcoin has compressed more than those assets, making it likely to lead the next larger move, though it could form a “lower high” before extending further. He added that ether could join in once it breaks $5,000 and enters price discovery. Lark Davis pointed to bitcoin’s history around September FOMC meetings, saying every September decision since 2020 — except during the 2022 bear market — has preceded a strong rally. He stressed that the pattern is less about the Fed’s rate choice itself and more about seasonal dynamics, arguing that bitcoin tends to thrive in this period heading into “Uptober.” CoinDesk Research’s technical analysis According to CoinDesk Research’s technical analysis data model, bitcoin rose about 0.9% during the Sept. 16–17 analysis window, climbing from $115,461 to $116,520. BTC reached a session high of $117,317 at 07:00 UTC on Sept. 17 before consolidating. Following that peak, bitcoin tested the $116,400–$116,600 range multiple times, confirming it as a short-term support zone. In the final hour of the session, between 11:39 and 12:38 UTC, BTC attempted a breakout: prices moved narrowly between $116,351 and $116,376 before spiking to $116,551 at 12:34 on higher volume. This confirmed a consolidation-breakout pattern, though the gains were modest. Overall, bitcoin remains firm above $116,000, with support around $116,400 and resistance near $117,300. Latest 24-hour and one-month chart analysis The latest 24-hour CoinDesk Data chart, ending 14:04 UTC on…
Share
BitcoinEthereumNews2025/09/18 12:42
UiPath (PATH) Stock Slides 5% Despite Crushing Earnings on Every Metric

UiPath (PATH) Stock Slides 5% Despite Crushing Earnings on Every Metric

TLDR UiPath beat Q4 estimates with EPS of $0.30 vs $0.26 expected, and revenue of $481M vs $465M expected The stock fell more than 5% in premarket trading despite
Share
Coincentral2026/03/12 18:09