

Bitcoin Liquidity Hits Six-Year Low as Whales Keep Buying: Here’s Where BTC Price Is Headed Next
TLDR:
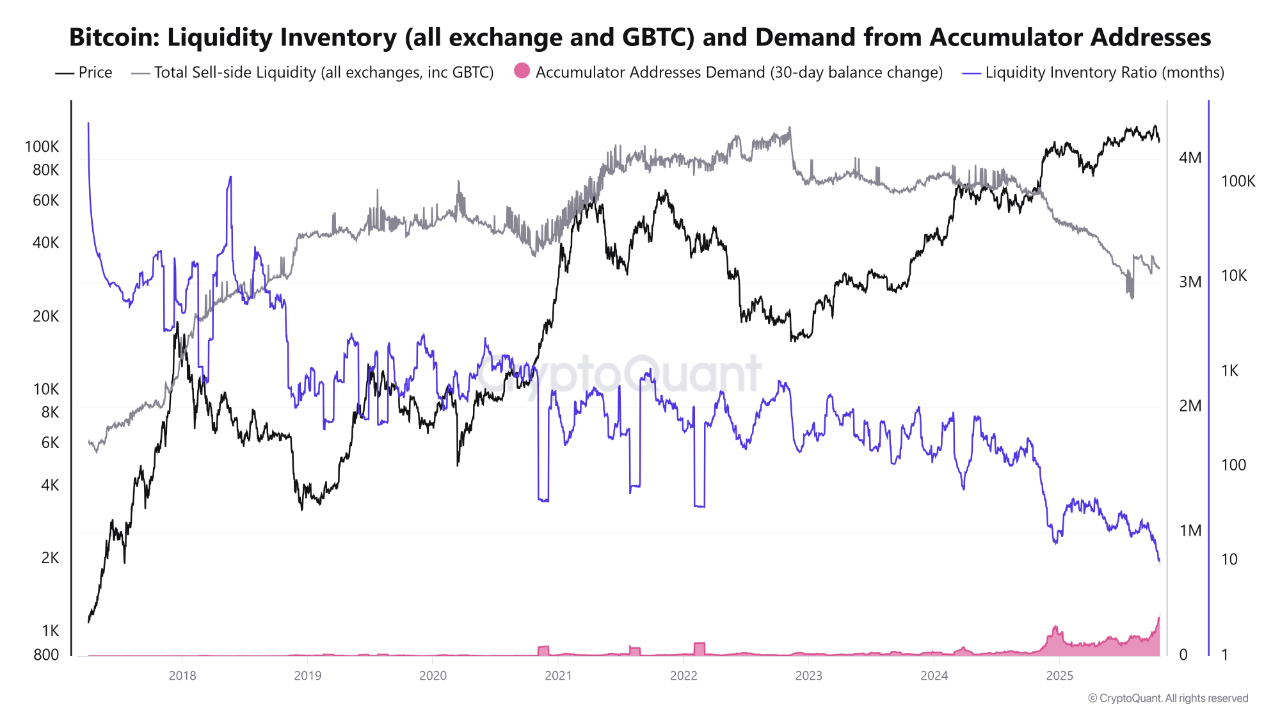
- Bitcoin sell-side liquidity drops to 3.12M BTC, the lowest level since 2018, showing strong market absorption.
- Accumulation wallets have added over 373,000 BTC in 30 days, fueling long-term holder dominance.
- Liquidity coverage now stands at just 8.3 months, pointing to tightening sell pressure in Bitcoin markets.
- Technical models project possible targets up to $175K as Bitcoin trades near the –1 SD regression line.
Bitcoin’s supply is tightening fast. Liquidity on exchanges has fallen to its lowest level since 2018, while long-term holders continue absorbing the available supply.
Data from CryptoQuant and analyst Arab Chain shows a sharp rise in accumulation activity, painting a picture of growing scarcity in the market. Traders say this setup has historically preceded strong price rallies.
With prices holding near $110,000, the question is how long before the next breakout comes.
Bitcoin Liquidity Squeeze Deepens
According to data shared by Arab Chain, sell-side liquidity has dropped to around 3.12 million BTC, marking a new six-year low. This decline reflects fewer coins available for sale on exchanges, even as demand remains elevated.
 Source: CryptoQuant
Accumulation addresses have purchased roughly 373,700 BTC in the last 30 days.
These wallets, often linked to long-term investors, typically buy during pullbacks and hold through market cycles. Their growing demand has created a tighter supply, forming what analysts describe as an early-stage accumulation phase.
CryptoQuant’s analysis shows the Liquidity Inventory Ratio has fallen to about 8.3 months. This means current liquidity can only meet less than nine months of demand, signaling a growing imbalance between buyers and sellers.
Historically, such liquidity squeezes have paved the way for rapid upside moves once momentum shifts.
Bitcoin’s price currently sits at around $110,067, according to CoinGecko data, up 3.99% over the past week. While short-term volatility remains, the underlying trend suggests reduced selling pressure in the market.
Technical Signals Hint at Major Upside
Technical analyst EGRAG CRYPTO noted that Bitcoin’s position on the linear regression chart sits at the –1 standard deviation, the lowest since 2012. He said that every previous cycle has seen Bitcoin consolidate inside a rising channel before breaking out strongly to the upside.
The model’s midline targets around $175,000, while the upper regression zone could reach $250,000 in the next expansion phase. Some traders see this as early confirmation of the next major leg higher.
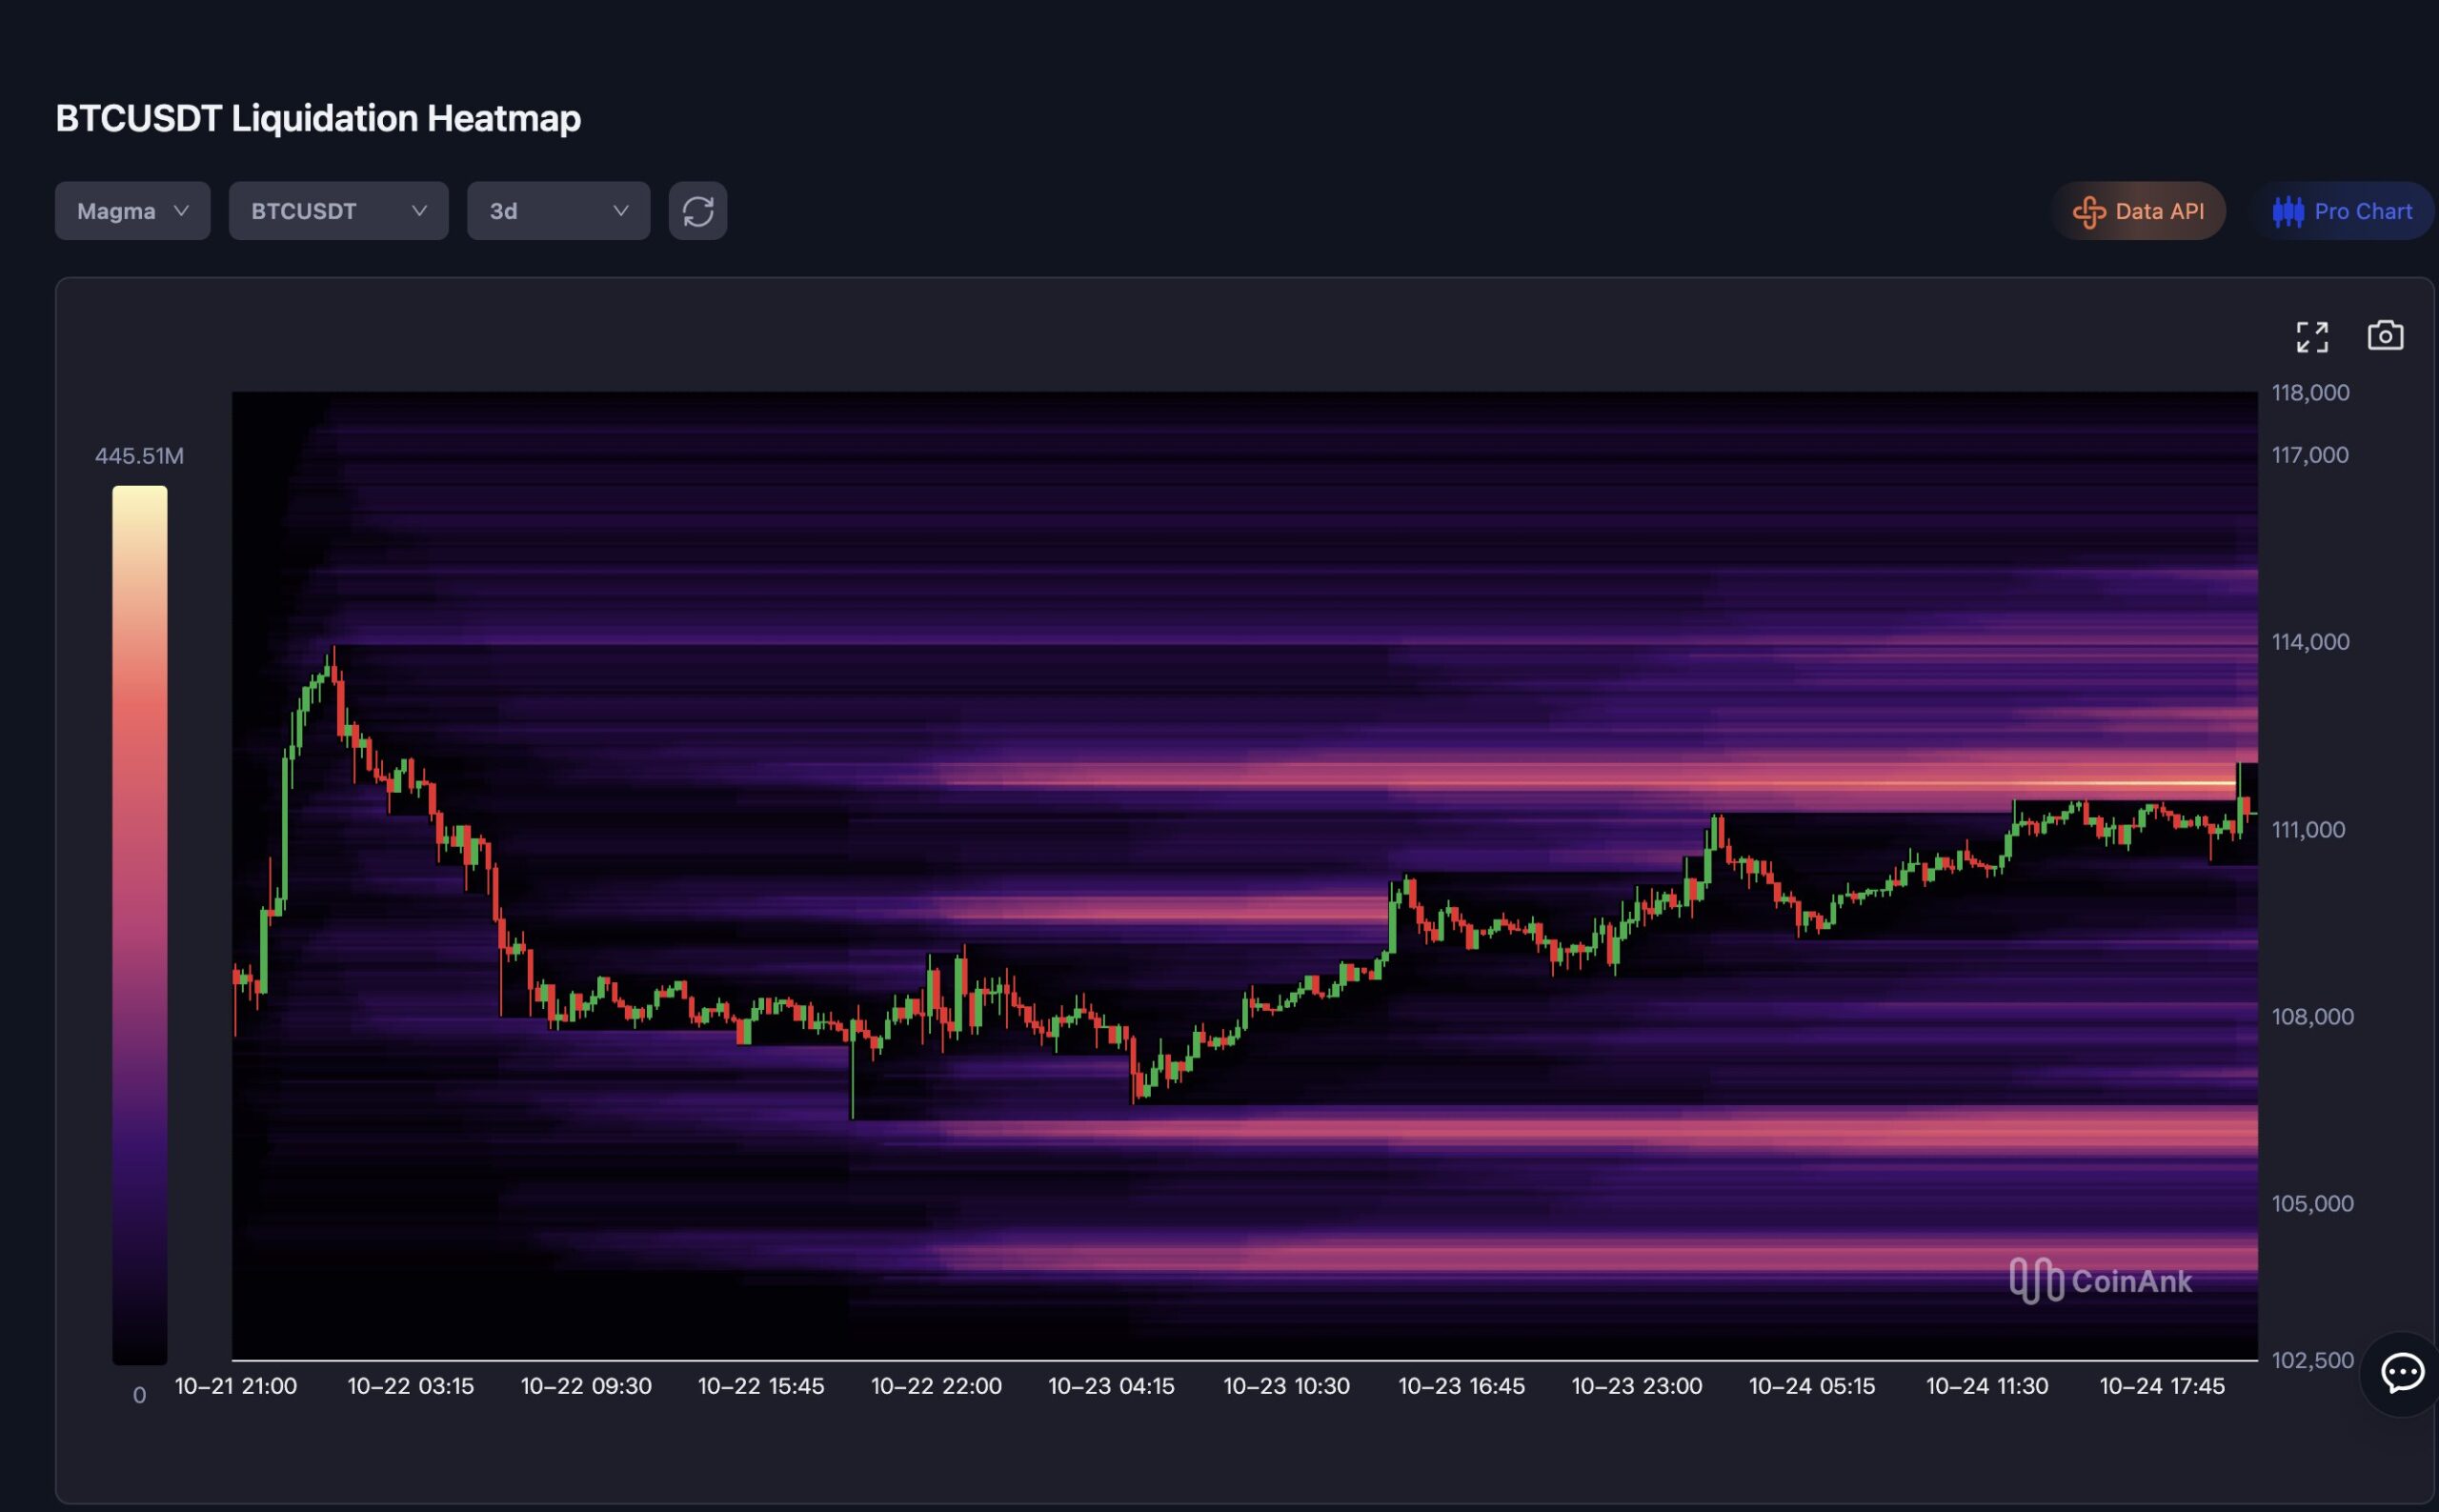
At the same time, CoinAnk’s latest liquidation heatmap highlights strong buyer activity around the $102,000 to $105,000 zone.
Multiple liquidations in this region suggest traders are defending those levels aggressively. Meanwhile, the $108,000 to $112,000 range has become a dense resistance band, where short-term sellers remain active.
 Source: X
Analysts say if accumulation continues and institutional demand rises through the end of Q4, BTC could test $115,000 sooner than expected.
The post Bitcoin Liquidity Hits Six-Year Low as Whales Keep Buying: Here’s Where BTC Price Is Headed Next appeared first on Blockonomi.


You May Also Like

Glassnode Says Speculative Interest in BTC Is Fading Across Traditional Markets

Cathie Wood sells $16.2 million of tumbling megacap stock

Solana Meme Coin Presale: Best SOL Picks 2026


Trending News
More24/7 Live News
MoreQuick Reads
More
