Ethereum ETFs Face Major Outflows as Investors Shift Focus – What’s Next for ETH?
- Ethereum ETFs face massive outflows as investor sentiment shifts drastically.
- Ethereum’s technical indicators signal uncertainty amidst rising Bitcoin ETF inflows.
- Ethereum’s market struggles persist despite October ETF inflows remaining positive.
Ethereum ETFs in the U.S. have experienced a dramatic shift in investor behavior, logging two consecutive weeks of significant outflows. In total, over $550 million has been pulled from Ethereum-focused exchange-traded funds (ETFs) in just 14 days, marking the first such occurrence in six months. Data from SoSoValue reveals that investors withdrew $311 million in the first week, followed by another $244 million the next.
Despite these outflows, Ethereum’s price has shown resilience, with a 4.12% increase on September 26, climbing from $3,869.7 to $4,034.4. The recent surge helped push Ethereum’s price above its 20-day simple moving average (SMA), indicating a brief rebound in the asset’s price. However, these gains do not appear to be enough to offset the overall downturn in investor sentiment surrounding Ethereum ETFs.
Also Read: ChartNerd: ‘5x-10x XRP is Very Doable’ – Here Are Key Levels For a Blow-Off-Top
Ethereum’s Technical Indicators Signal Uncertainty
Ethereum’s current technical indicators suggest mixed market signals. The Relative Strength Index (RSI) is at 38.59, putting it in the oversold range, which may hint at a potential recovery or further price decline. Additionally, the Bollinger Bands show Ethereum’s price is positioned at the lower end of its range, adding to concerns over potential volatility in the short term. These indicators suggest that Ethereum may face continued uncertainty, leaving investors hesitant about the asset’s short-term direction.
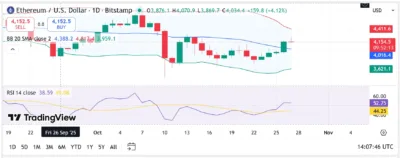
Source: Tradingview
Ethereum ETFs Still on Track for a Green October Despite Outflows
While Ethereum ETFs have seen outflows, they remain on track to close the month of October in positive territory. So far, Ethereum ETFs have accumulated $553 million in total inflows for the month. Still, the major outflows from key ETFs like BlackRock’s ETHA and Grayscale’s ETHE have caused a sharp drop in net assets, now below $27 billion, or about 5.5% of the circulating Ethereum supply. This trend is concerning, particularly as Bitcoin ETFs have received substantial inflows, with $446 million added in just one week.
Ethereum’s Path Forward in a Changing Market
Looking ahead, the future of Ethereum ETFs hangs in the balance. With mixed market signals and fluctuating investor confidence, Ethereum’s ability to recover in the ETF space will depend on broader market conditions and renewed investor trust. The latest outflows, coupled with Ethereum’s technical challenges, suggest that the cryptocurrency will need to regain momentum in the coming weeks if it is to maintain its position as a leading digital asset.
As Ethereum faces these hurdles, the performance of its ETFs will continue to be a critical area of focus for investors. The asset’s resilience in the face of outflows may ultimately determine whether Ethereum can stabilize and regain its standing in the competitive ETF market.
Also Read: XRP ETF Approval Just Around the Corner – Will It Unlock Billions in Capital?
The post Ethereum ETFs Face Major Outflows as Investors Shift Focus – What’s Next for ETH? appeared first on 36Crypto.


You May Also Like

PENGU climbs 17%, Market awaits break above $0.0102

XRP Coils at Key Support: Breakout to $1.50 Ahead?