

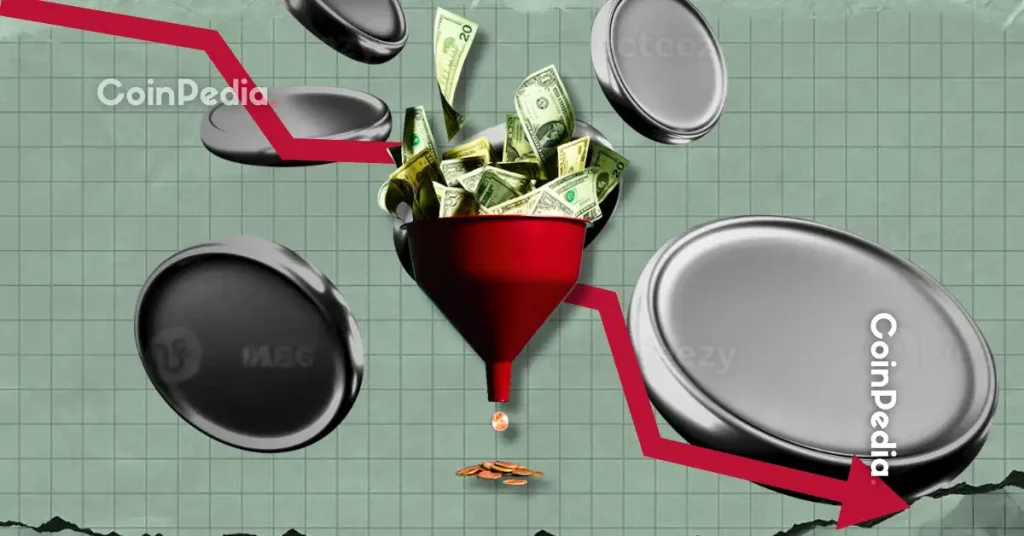
Crypto Market Cap Drops $1.2 Trillion in Eight Weeks – Was This Reset Needed?
The post Crypto Market Cap Drops $1.2 Trillion in Eight Weeks – Was This Reset Needed? appeared first on Coinpedia Fintech News
“Crypto didn’t crash. It was executed.”
That one line from analyst and author Shanaka Perera has everyone on X buzzing and recapping what happened in one of crypto’s most dramatic months. Over just eight weeks, the global crypto market cap fell from $4.6 trillion to $3.4 trillion, erasing nearly $1.2 trillion in value.
Was this just another crypto winter? Signs say no. It was a massive deleveraging event, a technical wipeout where too much leverage collided with too little liquidity.
The Day the Leverage Broke
On October 10, over $19 billion worth of leveraged positions were liquidated in just 24 hours, according to CoinGlass data. In the days around it, nearly 487,000 traders were wiped out daily.
The problem started when open interest, the total value of all futures contracts, hit a record $217 billion, while spot liquidity dropped to just 5% of normal levels. That imbalance created a feedback loop. As prices dipped, margin calls kicked in, triggering forced selling, which drove prices even lower.
By the end of the month, open interest had collapsed 43% to around $123 billion, marking one of the fastest market resets in years.
Sounds like it’s all bad. But the fundamentals are telling a very different story.
Meanwhile, Crypto Adoption Hit Record Highs
While prices fell, crypto adoption and on-chain activity hit all-time highs.
Independent data shows the number of global crypto users have jumped to around 560 million, up by 40 million in just six months. Stablecoins now power nearly 30% of all crypto transactions, triple their share from 2022.
Institutional players doubled down too. BlackRock and MicroStrategy collectively hold over 1 million Bitcoin, and major fund houses like Fidelity and Franklin Templeton have rolled out regulated crypto products.
Read More: Redditors Reveal Hard Truths of Crypto Investing After Years in the Market
In the U.S., the GENIUS Act was put into effect, and the CLARITY Act gave stablecoins a clear legal framework. In short – while traders were forced out, the builders and institutions kept moving in.
Why This Isn’t 2022 All Over Again
Back in 2022, both prices and adoption collapsed. Exchanges failed, regulation was unclear, and trust evaporated.
This time is different. The system reset itself rather than collapsing. DeFi lending volumes have grown to $39 billion, real-world asset tokenization crossed $8 billion, and blockchain infrastructure has become faster and cheaper.
What Comes Next
If history repeats, the next phase could be powerful. Perera points out that every major reset in crypto, from 2017 to 2021, was followed by new highs once leverage cleared out.
The indicators to watch now: open interest falling below $30B, ETF inflows topping $5B a week, and stablecoin supply growing 20% monthly. When those align, markets usually turn.
The markets seem to have cut off the noise. Once it settles, the same mechanics that broke the market could be the ones to push it higher again.


You May Also Like

3 Reasons Investors Are Following Mutuum Finance (MUTM) Since Q1 2025

Scotland remain bullish despite Morocco World Cup setback

186 undocumented migrants nabbed during midnight raid in Pudu


